Charlotte Gurr
After reading this article, you should be able to:
- Define an equivalence study and a non-inferiority study;
- Describe the main differences between equivalence and non-inferiority studies and the usual ‘superiority’ studies;
- Describe how to interpret the findings from equivalence and non-inferiority studies;
- Describe important potential problems with non-inferiority studies.
This article is the part of a comprehensive series exploring how to evaluate clinical studies when addressing information needs. Previous articles have focused on the clinical experimental trials conducted most frequently, namely ‘superiority’ studies. These studies are generally designed to determine if a new treatment is better than the control, usually a placebo or active therapy. The findings from these studies are either that the treatment is significantly different than the control (i.e. reject the null hypothesis of no difference — thus, one therapy is superior to the other), or the study treatment is not different than the control (i.e. fail to accept the null hypothesis of no difference in therapies). However, if the null hypothesis is accepted, it does not mean that the treatments are definitely the same — one can only conclude that no significant difference was found (see ‘Evaluating study results: statistical inference, hypothesis testing, significance’ for more details). In addition to the usual clinical ‘superiority’ trials, there are two other types of controlled experimental studies. These include equivalence studies and non-inferiority studies, with the latter increasingly used in clinical studies.
With both study designs, an active control is used (i.e. not a placebo). These studies are designed to determine if a new therapy is equivalent to (i.e. no better or no worse than) an active control therapy (i.e. equivalence study), or at least as efficacious as (i.e. no worse than) an active control (i.e. non-inferiority study). For more detailed discussion of the concepts reviewed in this article, the reader is referred to reviews by Leon1, Leung2 and Oczkowski3.
When reviewing the appropriateness of equivalence and non-inferiority studies, similar questions should be asked as for ‘superiority’ studies. Regardless of the type of experimental study, the journal that the study was published in should be of sound quality, and the study should be appropriately designed and performed, with the data properly analysed to ensure that the stated objective was adequately addressed. However, there are some differences from ‘superiority’ studies, particularly with the non-inferiority design, that should be considered when evaluating their quality. This article provides a brief review of equivalence and non-inferiority studies, with the focus on non-inferiority studies.
Equivalence study
In an equivalence study, the investigators are not concerned with determining if a new treatment is better than another therapy. Rather, they simply want to show that the treatments are not significantly different from each other (i.e. they are equivalent). The easiest way to think of an equivalence study is to think of a study that is trying to show that the bioavailability of a new generic drug is similar (i.e. equivalent) to the bioavailability of the control (i.e. brand name) drug. The generic drug’s manufacturers are usually not out to prove that the new generic drug has better bioavailability than the brand-name product — they would be happy with showing that it has equivalent bioavailability. Thus, their objective might be to demonstrate that the generic drug has similar bioavailability to the brand-name product using an equivalence study design.
To show that the generic drug has equivalent bioavailability, the investigators will choose an ‘equivalence’ margin or interval at the start of the study. For the bioequivalence example, this interval would be the range of bioavailability values considered equivalent to that of the brand-name product. If the bioavailability results for the generic drug fall within that range, the generic and brand drugs would be concluded to have equivalent bioavailability. Equivalence studies could also focus on outcomes other than bioequivalence, but they should not be used for clinical studies comparing therapy efficacy.
Equivalence study example
An equivalence study examines the bioavailability of new Drug A compared to established Drug B. The investigators identify at the start of their study an equivalence margin (expressed as a 95% confidence interval [CI]) of 80–125%. This means that Drug A will be concluded to be equivalent to Drug B if the bioavailability of Drug A is anywhere from 80% to 125% that of Drug B’s bioavailability. The study finds that the bioavailability of new Drug A = 92%, with a 95% CI = 88%–96%. Since this CI falls completely within the specified equivalence values of 80–125%, the drugs would be concluded to be bioequivalent. If the bioavailability of new Drug A was outside that range (i.e. some or all the reported CI values were either below 80% or above 125%), the conclusion would be that Drug A is not bioequivalent to Drug B.
Non-inferiority study
Clinicians should be familiar with non-inferiority studies since their results are interpreted in a different manner from usual ‘superiority’ studies. Superiority studies are most common and are conducted to determine if a therapy is better than (i.e. ‘superior’ to) another therapy (e.g. placebo, active drug). In contrast, a non-inferiority study is used to determine if a new therapy has at least the same efficacy as an established active control. Meaning, the new treatment could have better or the same efficacy as the active control, but not worse. A non-inferiority study generally uses non-inferiority analyses for the primary outcome(s) and end points, although this type of study might include some typical ‘superiority’ analyses for other outcome measures.
Most of the important design considerations for a non-inferiority study are the same as for a superiority study, including patient selection and use of blinding (i.e. double-blind preferred), randomisation to treatment groups, inclusion/exclusion criteria, drug dosing and administration, outcome measures, etc. There are some differences between non-inferiority and superiority studies, however. Non-inferiority studies should clearly state their objective was to examine non-inferiority and include the rationale for this type of design. Other important differences exist related to the interpretation of non-inferiority results, the null hypothesis and P values, and data handling.
Why perform a non-inferiority study?
A non-inferiority study might be useful for:
- Determining if a new drug with fewer side effects or other secondary benefits (e.g. raises ‘good’ high-density lipoprotein cholesterol, costs less, easier administration, better patient adherence) is at least as efficacious as an established therapy. If the new drug is shown to be non-inferior in efficacy to the established therapy, the new drug might be preferred owing to the secondary benefits;
- Establishing the efficacy of a new drug when there is an existing highly beneficial therapy and it is unethical or not possible to use a placebo control.
Interpretation of non-inferiority results
It is difficult to impossible to show that a new therapy has the exact same efficacy as a proven one, so a non-inferiority study is designed to show that the new therapy’s efficacy is not worse than an existing therapy by a pre-specified ‘allowable’ amount. Non-inferiority studies must specify in advance this allowable difference in efficacy, called the non-inferiority margin or threshold (or delta). This is the largest clinically acceptable difference between therapies allowed to conclude that the new therapy is not worse than the control.
Selecting the value for the non-inferiority margin (i.e. delta) is of critical importance. It is not a simple task to determine the best margin to use. For example, if a cure rate with a new drug is 4% lower than the control drug’s efficacy, is that an acceptable delta? Should no more than a 2% difference be allowed? Could a new drug have a cure rate 9% less than the control rate and still be acceptable? In general, how should an appropriate delta be selected?
Statistical methods and clinical judgement are primarily used to identify an appropriate non-inferiority margin/threshold based on the control therapy’s actual efficacy rate. For a specific control with proven efficacy, multiple studies including placebo comparisons are likely already available, and each study might report slightly different efficacy rates. The control therapy’s efficacy can be estimated using statistical analyses to pool the findings from prior (i.e. ‘historical’) studies of the active control vs. placebo. Placebo controls can provide a good indicator of the control therapy’s actual efficacy. This pooled estimate or a specified fraction of that estimate can then be used for the non-inferiority margin. Selection of a non-inferiority margin could also be based on findings from a meta-analysis of the control’s efficacy. The reader is referred to literature reviews (e.g. Althunian TA4, Kaul S5) for further discussion of methods used to determine the non-inferiority margin.
To interpret non-inferiority findings in a study, the non-inferiority margin and the 95% CI reported for the efficacy difference should be used, with the 95% CI providing a range likely to contain the population value for that measure. The non-inferiority margin (delta ∆) specifies the efficacy difference that the lower CI limit must not fall below (or the upper CI limit must not be above, depending on which therapy’s efficacy is subtracted from the other) for the new therapy to be considered non inferior to the control. For example, suppose a non-inferiority study compares the otitis media cure rate with new Drug A to the cure rate with an active control drug. A non-inferiority margin of 8% is specified for the difference in cure rates (active control cure rate – Drug A cure rate). For Drug A to be considered non inferior to the control, a value greater than 8% (i.e. unacceptable worse efficacy of Drug A) should not be in the CI range for the cure rate difference. Upon completion, the study reports the following cure rate with 95% CI: 6% (95% CI = 2% – 10%). How should this be interpreted? Although the study found a 6% difference in the cure rates between the control and new drug, the upper limit of the CI (10%) exceeds the 8% non-inferiority margin. Since the CI indicates that in the population the difference in cure rates could be higher (i.e. in the population, the difference in cure rates could be higher than the established ∆), non-inferiority cannot be concluded for new Drug A.
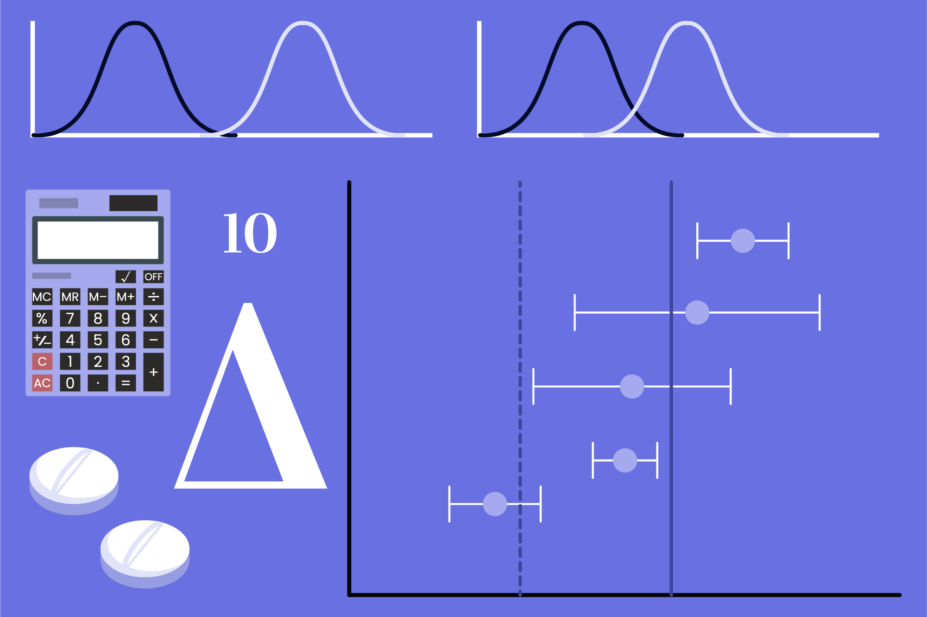
The Table below illustrates how to interpret several non-inferiority studies that have the same non-inferiority margin/threshold (∆) but with different CIs reported. In Study 1, when all CI values are worse than ∆, the new drug is concluded to be inferior to the control. In Study 2, none of the CI values are worse than ∆ so the new drug is concluded to be non-inferior to the control. In Studies 3 and 4, the lower end of the CI range is lower (i.e. worse) than ∆ so one can not conclude non inferiority of the new drug. In Studies 5 and 6, none of the values in the CIs are worse than ∆ so non-inferiority is concluded. Notice that in Study 6, all values in the CI range actually indicate that the new drug is superior to the control. When this occurs, the study will generally use statistical methods to establish superiority of the new drug.
Table: Interpreting non-inferiority — antibiotic example
Six different non-inferiority studies were performed to compare the cure rates with new antibiotic X (X) and ciprofloxacin (C) for the treatment of urinary tract infections.
For each study, the non-inferiority margin for the difference in cure rates between X and C was set at -5%; i.e. ∆ = -5% (Cure rate X – Cure rate C). Meaning, the investigators were willing to accept a cure rate for X that was up to 5% lower than the C cure rate and still conclude it was ‘non-inferior’.
Negative values in this example mean X is worse than C. A value of 0 means no difference in cure rates.
Positive values mean X is better than C. The following shows each study’s cure rate finding, with the 95% CI for the difference. The conclusion regarding non inferiority for each is shown in the right column.
Non-inferiority studies might report a relative risk (RR) or odds ratio (OR) (see ‘Understanding risk and clinical utility, dropouts, data handling and the discussion section when evaluating studies’) for efficacy measures instead of a therapy difference, with a non-inferiority margin specified for the RR or OR. The interpretation of non-inferiority in these studies would also use the CIs reported, analysed similarly as for treatment differences. The RR or OR values in the CI must not be worse than the specified non-inferiority margin to be concluded non-inferior. Refer to Worked example 1.
Worked example 1
A randomised, double-blind non-inferiority clinical trial was performed to compare the efficacy of a new factor Xa inhibitor (X) to enoxaparin control (E) for preventing thrombosis in patients with unstable angina or myocardial infarction. Based on findings from a published meta-analysis, the non-inferiority margin for the relative risk of thrombosis (X vs. E) was set at 1.185 (i.e. risk ratio (RR) could be slightly greater [worse] with X than E). At the end of six months, the study reported a RR for thrombosis development with X vs. E as RR = 0.99, 95% confidence interval (0.85, 1.13).
What should the conclusion be regarding non inferiority of X and E?
Since the upper limit of the CI is less than 1.185 (and no CI values exceed that), conclude X is non-inferior to E.
Does X appear to be superior to E?
No. The CI includes the value of 1 (i.e. no difference between drugs) as well as some values >1 that would indicate a slightly greater risk of thrombosis with X.
Suppose at the end of six months, the study reported the following RR but with a different 95% CI for thrombosis development with X vs E: RR = 0.99, 95% confidence interval (0.75, 1.23). What should the conclusion be regarding non inferiority of X vs. E?
The upper limit of the CI, 1.23, exceeds the non-inferiority margin of 1.185. As a result, one cannot conclude non inferiority.
Suppose at the end of six months, the study reported a different RR and 95% CI for thrombosis development with X vs E: RR = 0.69, 95% confidence interval (0.46, 0.91). What should the conclusion be regarding non inferiority of X vs. E?
Conclude that X is non-inferior to E since all values in the CI are < 1.185. Since X appears to be superior to E since all CI values for the RR are <1 (indicating less risk of thrombosis with X), additional analyses for superiority are appropriate.
Suppose at the end of six months, a different but similar study reported a RR and 95% CI for thrombosis development with X vs E: RR = 1.3, 95% confidence interval (1.2, 1.4). What should the conclusion be regarding non inferiority of X vs. E?
Conclude X is inferior to E. All CI values exceed the margin of 1.185, indicating that the risk of thrombosis is greater with X compared to E.
Worked example 2
A non-inferiority study compared 12 weeks of therapy with new Drug X to active control Drug Z to treat rheumatoid arthritis. The study set a non-inferiority margin of 5% for the difference in arthritis response rates between Drug X and Drug Z. Thus, Drug X would be non-inferior to Drug Z if the difference between their arthritis response rates (i.e. control Drug Z response rate minus Drug X response rate) was not greater than 5%. After 12 weeks, the study found that the response rate with Drug Z was 75.8% (95% CI = 72.6–79.0%) and the response rate for Drug X was 76.0% (95% CI =72.3–79.7%); difference between groups was −0.2% (95% CI = −4.3% to 4.7%).
Was non inferiority of Drug X shown in this study?
Yes. The study found a between-treatment difference (Drug Z efficacy minus Drug X efficacy) in arthritis response rates of −0.2%. However, do not use this study difference to interpret non-inferiority — use the CI instead. The reported CI for the treatment difference indicates with 95% confidence that the population difference in efficacy between Drug Z and Drug X will fall from 4.3% less, to up to 4.7% greater, with Drug Z compared to Drug X. Since the upper value of 4.7% in the CI is less than the predefined non-inferiority margin of 5% (and all the other CI values are likewise less than this cut-off), new Drug X can be concluded to be non-inferior to control Drug Z. No other conclusions can be made since the CI range includes 0, the value of equal efficacy, with values for both less and greater efficacy of new Drug X also included.
Could the non inferiority limit ever be a negative number?
Yes. In this example, the investigators chose to subtract the new Drug X efficacy from Drug Z efficacy (i.e. Drug Z − Drug X). When subtracting the drugs in this order, when control Drug Z has greater efficacy than Drug X the resulting efficacy difference would be positive. If the investigators had instead chosen to subtract Drug Z efficacy from new Drug X efficacy when identifying their non-inferiority margin (i.e. new Drug X – Drug Z), greater efficacy of control Drug Z would result in a negative non-inferiority margin (i.e. -5%). The worse the efficacy of new Drug X compared with Drug Z, the greater the efficacy difference and the larger the negative number will be.
*When you read non-inferiority studies, the specified inferiority margin might be positive or negative depending on which efficacy value (e.g. for new therapy or active control) is being subtracted from the other. Check whether the outcome reported is a beneficial one (e.g. success rate) or an undesirable one (e.g. adverse event development) to determine whether positive or negative differences are good or bad for that outcome.
Null hypothesis and P values
Non-inferiority studies can be tricky to interpret because the null hypothesis differs from that of the usual ‘superiority’ studies (see ‘Assessing authorship, study purpose and journals when evaluating clinical studies’). In a superiority study, the null hypothesis is that there is no difference between treatments, with the goal to reject this hypothesis and conclude that there is a real treatment effect. A non-inferiority study wishes to show that a new treatment is non-inferior to (i.e. not worse than) the control therapy by defining an ‘allowable’ clinical limit for any efficacy difference. Thus, the null hypothesis for a non-inferiority study is that the new treatment is inferior to (i.e. worse than) the active control by more than the specified amount, with a goal to reject this and conclude the new treatment is non-inferior. If the CI range for the efficacy difference does not exceed the specified non-inferiority margin, the null hypothesis of inferiority is rejected and the new treatment is considered non-inferior. We fail to reject the null hypothesis of inferiority when the CI for the efficacy difference crosses the non-inferiority limit (i.e. we cannot conclude non-inferiority). In Worked example 2, the non-inferiority margin for the efficacy difference was set at 5%. If all values in the CI range for the efficacy difference between drugs exceeded 5%, the conclusion would be that new Drug X is inferior to active control Z.
A type I error is rejecting the null hypothesis when it is really true, and a type II error is when one fails to reject the null hypothesis when it is false and should be rejected (see ‘Evaluating study results: statistical inference, hypothesis testing and significance’). Using the statistical significance cut-off of 0.025 for a non-inferiority study (refer to Box), a type I error is possible when P < 0.025 and a type II error is possible when P ≥ 0.025. A non-inferiority study interprets type I and type II errors using its null hypothesis definition (i.e. new treatment is inferior to control by more than pre-specified margin). In a non-inferiority study, a type II error (i.e. failing to reject the null hypothesis of inferiority when it should be rejected) means that the study concluded in error that the new treatment was inferior to the control, when it really was non-inferior. A type I error (i.e. falsely rejecting the null hypothesis of inferiority) means that the study wrongly concluded that the new treatment was non-inferior to the control when it actually was inferior by more than the pre-specified margin.
Box: Interpreting P values for non inferiority analyses
As discussed in Evaluating study results: statistical inference, hypothesis testing and significance, P = 0.05 is generally used as the cut-off for statistical significance for typical ‘superiority’ studies. Non-inferiority studies usually report a CI to compare to the non-inferiority margin; use the CI to interpret non inferiority when provided. Since the primary focus of a non-inferiority study is one-sided (ie., not worse than), a statistical significance cut-off of P = 0.025 is commonly used when a P value is reported for a one-sided non-inferiority analysis. When interpreting reported P values for a non-inferiority efficacy analysis, use the following as a guide unless otherwise specified by the study:
- If P < 0.025, reject the null hypothesis of inferiority and conclude that the new treatment is non inferior to the active control;
- If P ≥ 0.025, fail to reject the null hypothesis of inferiority and conclude that non inferiority has not been shown.
Non-inferiority studies can also include ‘superiority’ analyses. These analyses are usually done for secondary outcome measures or to document superiority when indicated from a non-inferiority analysis. When P values are reported for superiority analyses as part of a non-inferiority study, a ‘superiority’ cut-off of P < 0.05 is generally used.
Sufficient power is important for both superiority and non-inferiority studies. Having too low of a power in a superiority study increases the risk of failing to identify a true difference between therapies (i.e. type II error). However, too little power in a non-inferiority study increases the risk of failing to show non inferiority (i.e. failing to reject null hypothesis of inferiority when new treatment really is non inferior to the active control). Investigators want a high likelihood of showing non-inferiority of a new therapy when it truly meets the non-inferiority criterion with a proven active control. Thus, a power of 90% or greater is often desirable for a non-inferiority study. A side benefit of aiming for a higher power is that a larger sample size is required, resulting in a narrower more precise CI range (important since the CI values should not cross delta to demonstrate non inferiority).
Data handling
Intention to treat data handling is usually preferred for superiority studies since it can minimise bias related to how/when patients drop-out of a study, and it better reflects clinical practice (see ‘Understanding risk and clinical utility, dropouts, data handling and the discussion section when evaluating studies’ for a discussion on data handling). Intention to treat will often result in lower efficacy findings if drop-outs or major protocol violation issues are present, since patients will be included in their original assigned group for data analyses regardless of whether they completed the treatment protocol. In contrast, per protocol (PP) analyses tend to show higher efficacy rates by only including those who completed the assigned protocol.
Which data handling method is recommended for non-inferiority analyses? Both methods are recommended. Intention to treat has the benefits described for superiority studies. However, it is also important to include the PP analysis. A PP analysis helps ensure that the active control does not perform worse than expected owing to dropouts or protocol violations, which may minimise a treatment difference and lead to an erroneous conclusion of non inferiority. The reader can have greater confidence in the findings when both data handling methods support the finding of non-inferiority of a new therapy to a proven active control.
Potential problems with non-inferiority studies
Although there are some valid reasons for performing a non-inferiority study as previously indicated, there are also potential problems with this type of study design. Some of these problems include:
- How large should the non-inferiority margin be? How does one determine the size of the difference that would make a new drug ‘just a little inferior’ but still clinically acceptable to a proven therapy? These questions are difficult to answer. One does not want the new drug to be considered ‘non-inferior’ to proven therapy only because the non-inferiority margin was set too large. Otherwise, the new drug may really be less clinically beneficial than the active control. On the other hand, investigators could set a relatively small non-inferiority margin/threshold, analogous to the effect size used to determine sample size in a ‘superiority’ study. This would result in a larger sample size needed to achieve adequate power in the non-inferiority study, which might make the study difficult to conduct. A margin that is realistic and represents the largest clinically acceptable loss of efficacy should be used.
- In a ‘superiority’ study, if the study does not have sufficient power to identify a real treatment effect, it can wrongly conclude there is no significant difference in efficacy between treatments. In a non-inferiority study, inadequate power can result in a failure to find a new drug to be non-inferior when it actually is non-inferior to an active control. Thus, adequate power is important in both superiority and non-inferiority studies.
- What if the active control does not show the expected efficacy in a non-inferiority study? This may be owing to the types of patients included or other factors. In this case, the study might find the new drug to be non-inferior to the active control, but neither drug was efficacious.
- A non-inferiority study gives only the relative efficacy of a new drug compared to an active control. One still does not know how the new drug would perform compared to a placebo.
- Pharmaceutical manufacturers might be tempted to conduct a non-inferiority study to show that a ‘me-too’ drug, one with no real advantages in practice, has similar efficacy to an established therapy.
- It is possible that a slightly inferior treatment might become the active control for the next generation of non-inferiority trials. This could result, in theory, in continuing ‘slightly inferior’ treatments making their way into practice, with diminishing efficacy results over time.
Key points
Owing to the differences between non-inferiority versus ‘superiority’ studies and the potential for confusion, the following should be clearly stated in a non-inferiority study:
- The rationale for choosing a non-inferiority design as compared to a ‘superiority’ study;
- The specific objective(s) and hypothesis;
- The non-inferiority margin/threshold (∆), how they identified it and how it should be interpreted;
- How the sample size and statistical power were calculated;
- Why the active control used was selected;
- Whether the active control showed the expected efficacy in the study;
- How the results should be interpreted.
Also determine whether there are any weaknesses or limitations in the study’s design (e.g. blinding, randomisation), methods (e.g. inclusion/exclusion criteria, outcome measures, statistical analyses, data handling), or findings that would limit its validity (i.e. internal and external).
How to apply to practice
- Look carefully at the delta used in a non-inferiority study and determine if it appears reasonable clinically (i.e. not so large that a possibly inferior new drug might still be shown to be ‘non-inferior’);
- Consider whether the investigators really needed to use a non-inferiority design — does the new drug being studied have clinically important secondary advantages over the control drug?
- Be extra cautious about applying the results from a non-inferiority study that appears to be comparing a ‘me-too’ drug to an established active control drug. Do there appear to be potential conflicts of interest for the study investigators that might have influenced their selection of this study design and the interpretation of its findings?
- If non-inferiority is shown and the study design and methods are sound, consider whether the proposed advantages of the new therapy justify its use clinically over a therapy with proven efficacy.
Summary
This article provides definitions and a brief overview of two additional types of experimental trials that clinicians should be familiar with, equivalence and non-inferiority studies. While the general considerations for evaluating quality of the more commonly conducted ‘superiority’ studies would also apply to equivalence and non-inferiority studies, some important differences were described.
Self-assessment questions
Question 1
What is the importance of the non-inferiority margin used in a non-inferiority study? Briefly explain.
Question 2
What is the null hypothesis in a non-inferiority study? Does it have the same meaning in a ‘superiority’ study?
Question 3
What P value is usually used as the cut-off for statistical significance for a one-sided analysis on non-inferiority?
A: 0.01;
B: 0.025
C: 0.05
D: 0.10
Question 4
Which of the following should generally be used in a non-inferiority study to interpret the efficacy results?
A: P values
B: CIs
Question 5
The non-inferiority margin is also referred to as which of the following?
A: Alpha
B: Beta
C: Delta
D: Gamma
Question 6
A non-inferiority study compared the efficacy of piperacillin-tazobactam (PT) to meropenem (M) to reduce mortality in patients with a bloodstream infection (BSI). M (control) is usually given to treat these infections but there are concerns about resistance development. A non-inferiority margin of 5% was set for the mortality difference (PT – M) at 30 days. Suppose this study found the following: of the BSI patients randomised to receive either drug, 6.3% of patients taking PT died compared with 4.7% of patients taking M (difference = 1.6%, 95% CI = -1.8% to 4.2%).
Based on this finding, what is the conclusion regarding non-inferiority of PT and M?
Answer guidance
Question 1
The non-inferiority margin should be the largest clinically acceptable difference in efficacy between treatment groups. If the efficacy difference actually found is smaller than the specified margin, it would indicate that the new treatment is at least as good within the margin specified, as the active control (i.e. the new treatment is non-inferior to the control).
Question 2
The null hypothesis for a non-inferiority study is that the new treatment is inferior to the active control. No, it does not have the same meaning in a ‘superiority’ study. The null hypothesis for a ‘superiority’ study is that there is no difference between/among the treatments studied.
Question 3
B: 0.025. When a non-inferiority study reports a P value for non-inferiority, it is often one-sided (looking for a change in the direction of not worse than), and P = 0.025 is generally used as the cut-off for statistical significance. It is important not to confuse a P value reported for non inferiority in a study that also conducted ‘superiority’ analyses for certain outcome measures. P values for superiority analyses are usually two-sided and use a cut-off of 0.05 for statistical significance (unless the study specifies otherwise).
Question 4
B: CIs. They are generally reported for the efficacy results in a non-inferiority study. For the new treatment to be non-inferior to the control, the lower value of the treatment CI should not fall below the specified non-inferiority margin (or the upper limit should not be above this margin, depending on which efficacy value is being subtracted from the other) in order for the new treatment to be considered non-inferior.
Question 5
C: Delta ∆.
Question 6
PT is concluded to be non-inferior to M. The upper end of the CI does not exceed the delta of 5%. The values in the CI range from worse mortality with PT (by an acceptable margin), to the same mortality (zero included in CI), to less mortality with PT compared to control (negative numbers).
Acknowledgements
This article was adapted from Drug Information and Literature Evaluation, Second Edition, previously published by Pharmaceutical Press.
A full list of resources and materials used to prepare the book can be accessed from the bibliography page.
- 1.Leon AC. Comparative Effectiveness Clinical Trials in Psychiatry. J Clin Psychiatry. 2011;72(10):1344-1349. doi:10.4088/jcp.10m06089whi
- 2.Leung JT, Barnes SL, Lo ST, Leung DY. Non-inferiority trials in cardiology: what clinicians need to know. Heart. 2019;106(2):99-104. doi:10.1136/heartjnl-2019-315772
- 3.Walsh Oczkowski SJ. A clinician’s guide to the assessment and interpretation of noninferiority trials for novel therapies . ResearchGate. May 1, 2014. Accessed October 9, 2026. https://www.researchgate.net/publication/263815322_A_clinician’s_guide_to_the_assessment_and_interpretation_of_noninferiority_trials_for_novel_therapies
- 4.Althunian TA, de Boer A, Groenwold RHH, Klungel OH. Defining the noninferiority margin and analysing noninferiority: An overview. Brit J Clinical Pharma. 2017;83(8):1636-1642. doi:10.1111/bcp.13280
- 5.Kaul S. Understanding the Merits and Drawbacks of Noninferiority Trials in Cardiovascular Medicine. Canadian Journal of Cardiology. 2021;37(9):1378-1393. doi:10.1016/j.cjca.2021.05.017