You can view the full infographic here
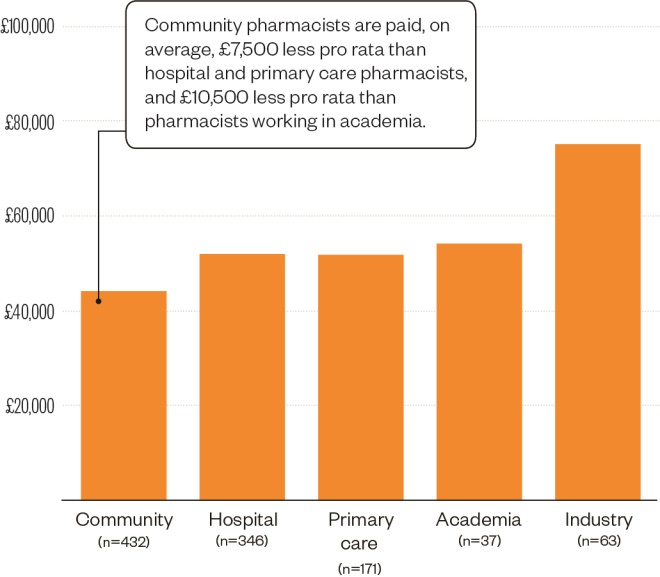
Figure 1: Salary by sector
Median annual salary by sector, based on hourly rate and assuming a 40-hour work week
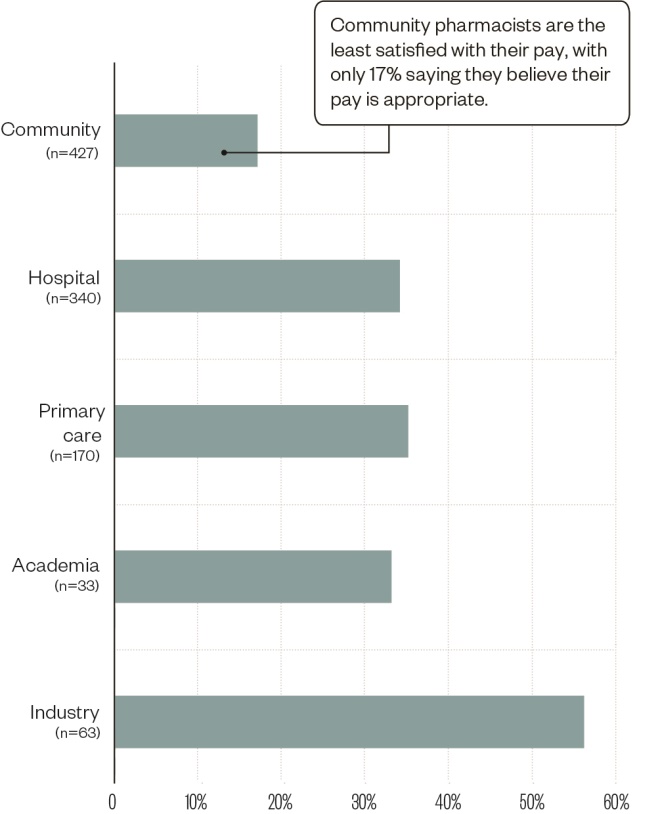
Figure 2: Appropriate pay
Percentage of pharmacists who think their pay is appropriate for the job they do
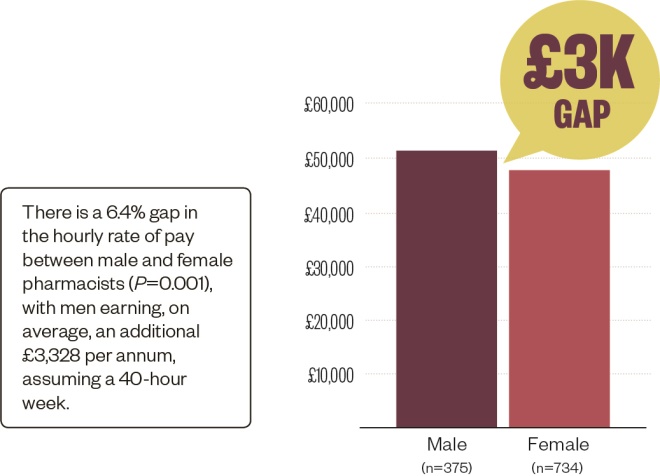
Figure 3: Gender pay gap
Gender pay gap taking into account part-time workers
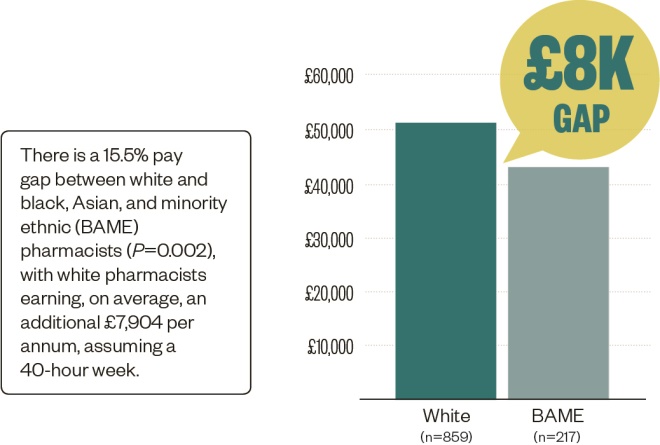
Figure 4: Ethnicity pay gap
Ethnicity pay gap taking into account part-time workers
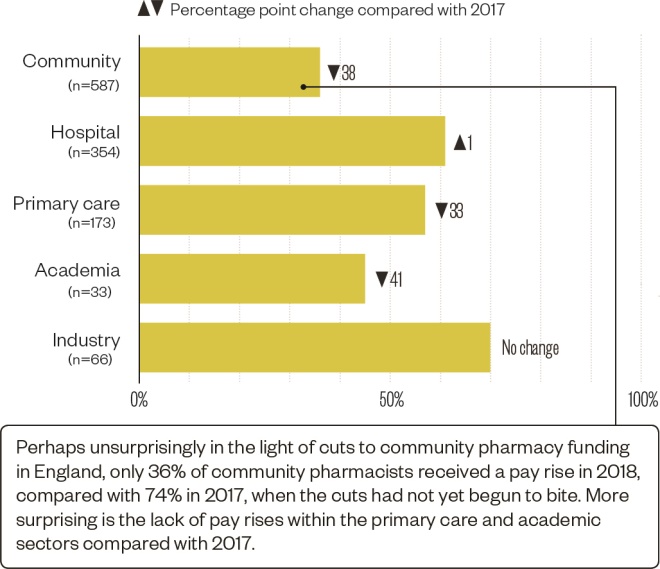
Figure 5: Pay rise
Percentage of pharmacists who have had a pay rise in the past year
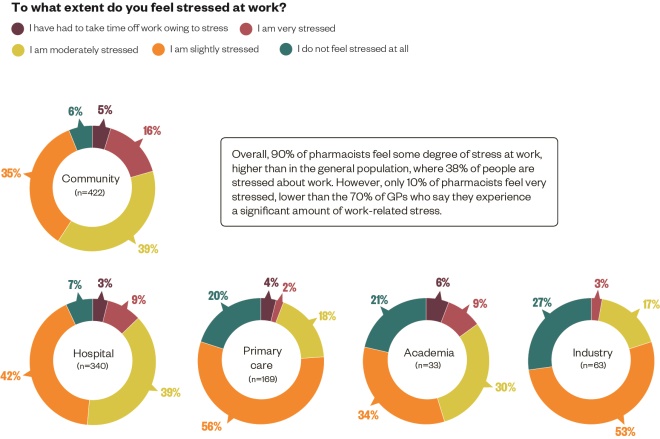
Figure 6: Stress
The degree of work-related stress felt by pharmacists
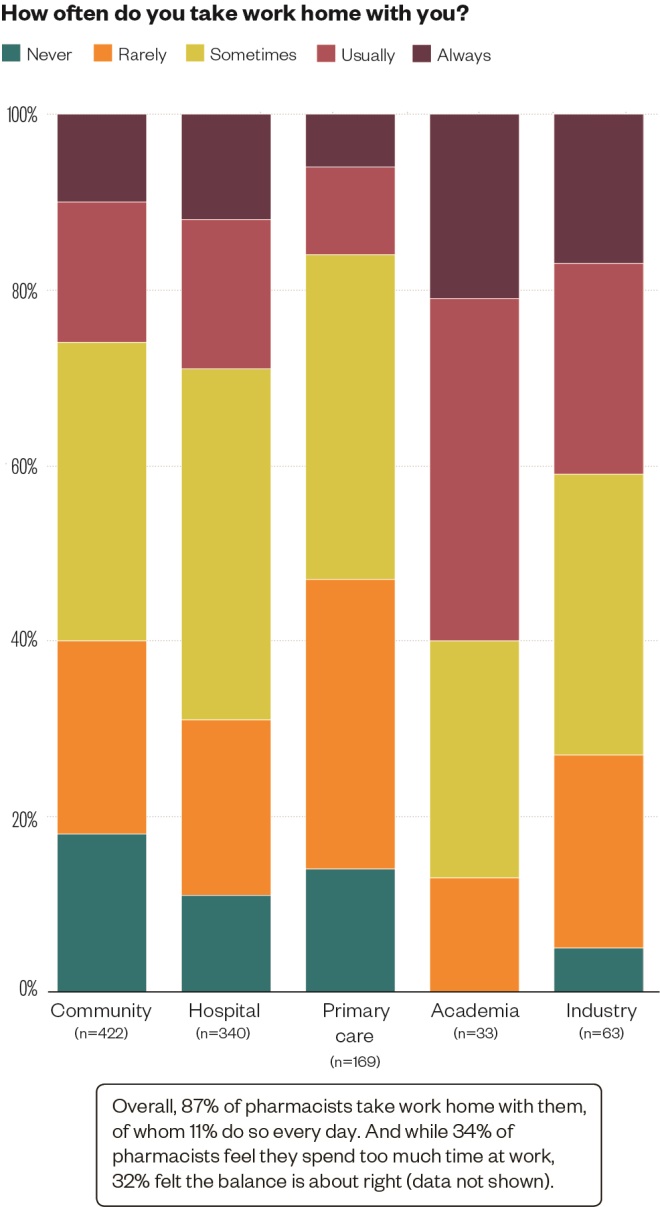
Figure 7: Work/life balance
The frequency with which pharmacists take work home
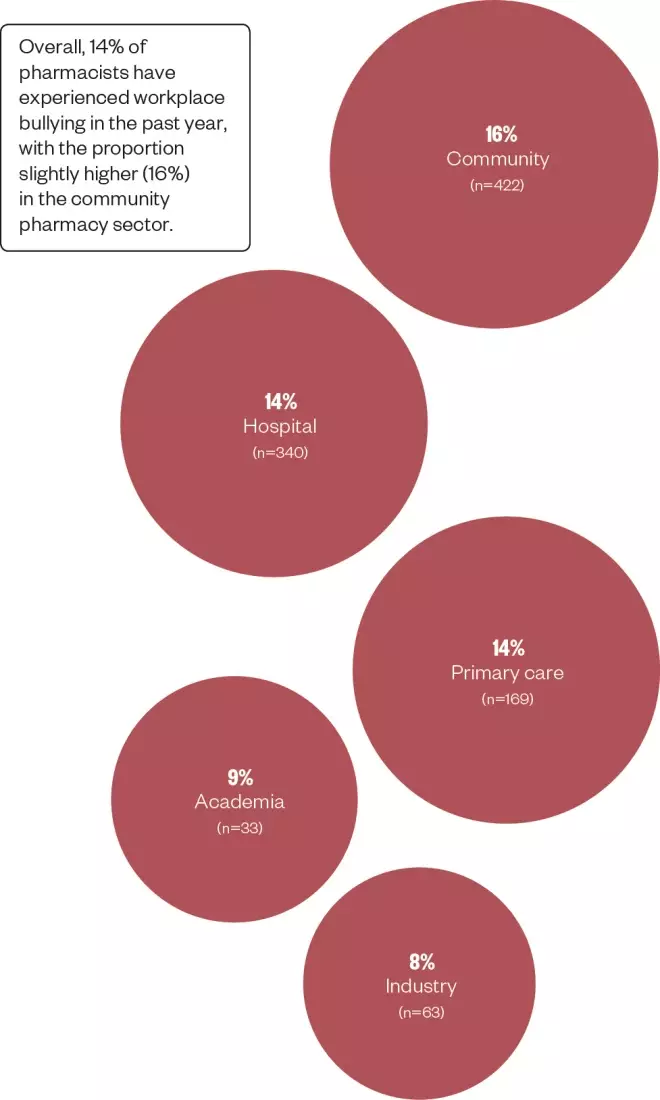
Figure 8: Bullying
Percentage of pharmacists who say they have been the victim of bullying from another member of staff in the past year
References
Sources: The Pharmaceutical Journal salary and satisfaction survey 2018 included 1,175 pharmacists and was analysed by independent academic statisticians at the University of Aberdeen. In the survey, community pharmacists were under-represented compared with all RPS members (38% vs. 52%). Hospital and primary care pharmacists were over-represented (31% vs. 23% and 15% vs. 4%, respectively). Industry and academic pharmacists were roughly comparable (6% vs. 5% and 3% vs. 3%, respectively). The BAME population was marginally younger than the white population surveyed, with half of BAME respondents aged under 35 years (compared with just 20% of white respondents). The results displayed are for non-locum pharmacists only. Respondents to the 2017 survey also included preregistration traines and pharmaceutical scientists.
Additional sources: AXA Stress Index 2017; British Medical Association.
Infographic: nicolahawesdesign.com