This content was published in 2004. We do not recommend that you take any clinical decisions based on this information without first ensuring you have checked the latest guidance.
Identify knowledge gaps
- List three uses for clinical testing.
- How can the quality of a clinical test be assessed?
- List three factors that can affect the results of a clinical test.
Before reading on, think about how this article may help you to do your job better. The Royal Pharmaceutical Society’s areas of competence for pharmacists are listed in “Plan and record”, (available at: www.rpsgb.org/education). This article relates to “diagnostic tests” and “therapeutic drug monitoring” (see appendix 4 of “Plan and record”).
Patients can generate a mass of laboratory data, including reports from haematology, biochemistry and microbiology departments. Some of these will be relevant to drug therapy in that test results can call for a dosage adjustment or a change of drug. Patients can also undergo various types of diagnostic scan such as magnetic resonance imaging (MRI), computed tomography (CT) and ultrasound. Community pharmacists are often asked about such tests. Before a test, patients may want to know what the procedure involves and, after a test, they may be worried about the results and what they could mean. Pharmacists can do a great deal to allay such fears by giving clear, confident explanations of tests. An awareness of the tests used to identify early signs of disease (eg, mammography, cervical smear) will also facilitate the role of pharmacists in health promotion.
Pharmacists who work either in hospital or primary care and those with access to patient records, also need to be familiar with test results and what they might mean. Not all laboratory data are of direct relevance to pharmacy, but a general knowledge of these is recommended in order to understand a patient’s medical background and to be able to discuss the care of patients with other health care professionals.
Increasingly, pharmacists are offering diagnostic (“near-patient”) testing in addition to selling a widening range of testing kits for home use. They also, therefore, need to be able to interpret results and advise patients appropriately. This series of articles will explore many of the aspects of clinical testing.
Uses of clinical tests
Clinical tests can be used for several purposes:
- To confirm or support a diagnosis (eg, bone densitometry for suspected osteoporosis, biopsy in suspected coeliac disease and fasting blood glucose in suspected diabetes mellitus)
- To assess the severity of a disease (eg, MRI for the stage of a tumour and measuring creatinine clearance to assess the level of renal impairment)
- To monitor the response to a treatment (eg, serum cholesterol following initiation of lipid-lowering therapy)
- To monitor appropriate drug dosing (eg, international normalised ratios for oral anticoagulants)
- To help prevent toxic side effects and interactions (eg, monitoring serum lithium levels)
Interpretation of test results
Test results can be expressed qualitatively, quantitatively or semi-quantitatively. Results from scans and endoscopic procedures are largely qualitative. They will describe the appearance of the tissue under investigation and will explain the clinical significance of any abnormalities.
Haematology and biochemistry results are generally expressed quantitatively (ie, as a set of numbers) and microbiological results tend to be semi-quantitative in that reports will identify the micro-organisms present and describe their sensitivities to antibiotics.
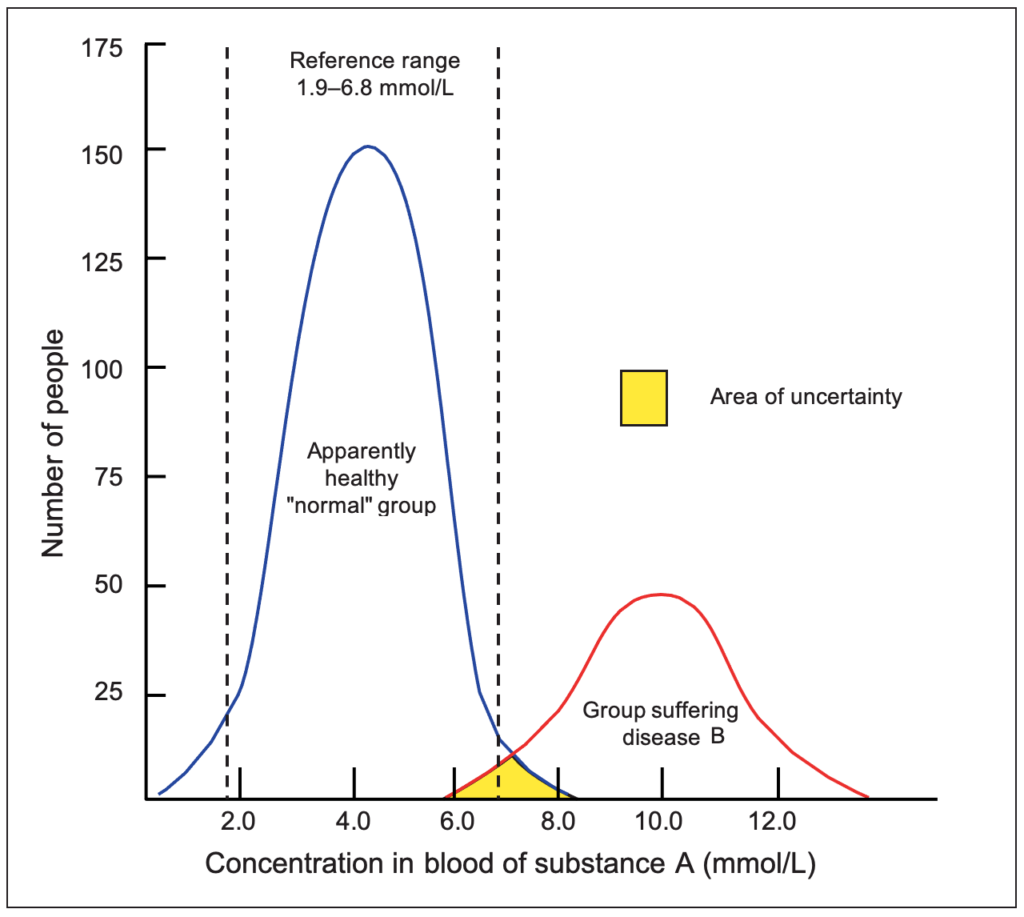
Reference ranges: Test results can be classified as either positive or negative. A cutoff point at either end of a normal distribution curve for a population (see Figure 1) can be used to distinguish between these results. The two points describe what is known as the reference range for a particular test. Figure 1 shows the results of measuring the concentration of a substance A in the blood of a large population of apparently healthy individuals (the reference population) and of a population with a disease B. If the blood concentration of A is usually raised in patients with the disease, a blood test can confirm the diagnosis among patients who have symptoms of the disease.
In Figure 1, the blood concentration of A among apparently healthy individuals ranges from 1.0 to 8.0mmol/L. If the blood concentration of A in a patient exceeds 8.0mmol/L there is a high degree of certainty that he or she has disease B. Similarly, a person with a blood A concentration lower than 6.0mmol/L does not have the disease. However, an area of uncertainty exists for those with blood levels of A between 6.0 and 8.0mmol/L. To take account of this, all reference ranges are conventionally constructed to exclude the results of 2.5% of the reference population, whose results lie at either end of the normal distribution. The reference range typically represents the mean result plus two standard deviations observed in a large population of healthy individuals. In other words, it covers 95% of the healthy population.
It is important to be aware that reference values can vary from one laboratory to another and it is always advisable to compare a result with the reference values of the laboratory in which a sample in question has been tested. With some tests, such those measuring serum sodium and potassium levels or red and white blood cell counts, differences in reference ranges between laboratories will be negligible. However, other tests, such as enzyme assays, can have considerably different ranges depending on the laboratory used and results must be interpreted accordingly.

Adapted from Harman RJ, Mason P (editors). Handbook of Pharmacy Healthcare. 2nd ed. London: Pharmaceutical Press;2002
Value of a test result
Test results are not perfect. They must be properly interpreted in the light of analytical performance, which includes accuracy and precision, and clinical performance, which varies with sensitivity, specificity and predictive value.
Accuracy and precision: Accuracy is defined as the extent to which the mean measurement is close to the true value. For example, if a sample, spiked with a known quantity of a substance, is measured many times and the mean measurement is calculated, the closer the mean is to the known concentration, the higher the accuracy of the assay. Precision refers to the reproducibility of the assay, ie, the agreement of results when the specimen is assayed many times.
Measurements of accuracy and precision are among the many quality controls routinely conducted by laboratories. Often, an outside agency provides samples to a laboratory for testing. The laboratory then sends the test results to the agency (which knows the true values) so analytical performance can be checked.
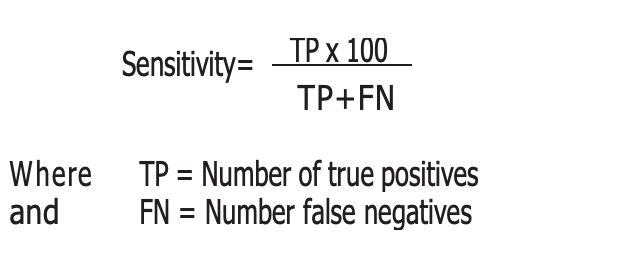
Sensitivity: The sensitivity of a test refers to its ability to show positive results in patients who have the disease in question (ie, true positives). Expressed as a percentage, it is defined as the proportion of people with the target disorder who have a positive result. The higher the sensitivity, the greater the detection rate and the lower the false negative rate. The following equation is derived by using the values obtained from a predictive value table, such as Table 1:

| Result | Diseased | Not Diseased | Total |
|---|---|---|---|
| Positive | TP | FP | TP+FP |
| Negative | FN | TN | FN+TN |
| Total | TP+FN | FP+TN | TP+FP+FN+TN |
TP = True positives (diseased persons detected by the test)
FP = False positives (non-diseased persons positive to test)
FN = False negatives (diseased persons not detected by test)
TN = True negatives (non-diseased persons negative to test)
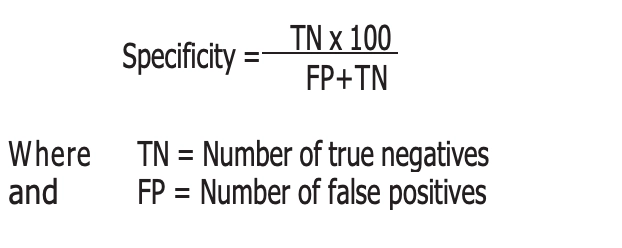
Specificity: Specificity refers to the percentage of negative results among people who do not have the disease in question. The higher the specificity, the lower will be the false positive rate. In practical terms this means that there will be a lower proportion of healthy people who will be unnecessarily worried or exposed to treatment. The following equation is derived by using the values obtained from a predictive value table (see Table 1).

Ideally, tests should be both highly sensitive and specific. However, scientific limitations mean this is not always possible. The choice of test will also be influenced by cost, practicality and other considerations. For example, a test with high sensitivity should be used if missing a condition could have fatal results. A test with high specificity should be chosen when treatment options for a disease have serious adverse effects.
Predictive value: In a clinical setting, the question of interest is whether a test result outside the reference range really indicates that a patient has a particular disease or whether a result within the reference range correctly excludes the existence of disease. In other words, what is the predictive value of the test?
The predictive value of a positive result (outside reference range) is the percentage of positive results that are true positives. In other words, it is the probability of disease given a positive test result. The predictive value of a negative result is the percentage of negative results that are true, ie, it is the probability of no disease given a negative result.
Predictive value can also be related to the prevalence of a disease in a population. When disease prevalence is low, the probability that positive test results are correct is small. The significance of a positive test may, therefore, be greater in hospital than in general practice because the prevalence of the disease is higher in the hospital population. Hospital doctors frequently criticise general practitioners for “missing a diagnosis” because the significance of a positive test result in hospital practice is, for most tests, statistically different from general practice. Table 2 illustrates the effect of disease prevalence on the predictive value for a test with a sensitivity and specificity of 95%.
| Prevalence of disease (%) within population | Predictive value of positive test result |
|---|---|
| 1 | 16.1 |
| 2 | 27.9 |
| 5 | 50.0 |
| 10 | 67.9 |
| 25 | 86.4 |
| 50 | 95.0 |
Sensitivity 95%, Specificity 95%
Factors affecting test results
A variety of factors can influence test results, and these should always be considered before the patient is advised. For example:
- Specimens commonly analysed in laboratory tests are whole blood, serum (or plasma), urine and cerebrospinal fluid. The reference range for a substance in one body fluid can be different from that in another. These can be easily confused, especially when clinicians misuse terminology (eg, “serum glucose” is often inappropriately referred to as “blood glucose”).
- Reference ranges can differ significantly with various measurement methods used in different types of assay.
- The way in which a specimen is collected, transported, stored and processed can affect results. For example, blood gases require that samples be processed immediately because carbon dioxide concentration can change significantly after 24 hours. Similarly, many hormones are unstable and serum should be frozen if analysis is not performed immediately. Delay in separating serum from cells in a blood collection tube will give false results in potassium and glucose measurements. It is estimated that glucose results fall by up to 7% per hour if serum is not separated. Conversely, the longer the contact time between serum and cellular elements, the greater the measure of potassium because extra potassium is released from the cells.
- The levels of several blood constituents fluctuate throughout the day and can affect results so some tests require a sample be collected at a specific time. For example, a morning urine specimen is best for detecting levels of protein outside normal reference ranges.
- The age of the patient can affect results. For example, white cell count is higher at birth than in adulthood and blood urea and serum-cholesterol concentrations increase with age. Enzymes, such as creatine kinase may decrease after the age of 60 or 70 years.
- Blood hormone levels, red cell counts and haemoglobin concentrations have different reference ranges in men and women.
- Pregnancy can affect thyroid function tests and haematological parameters.
- Although the effects of race or nationality on the blood concentrations of most parameters is small, muscle mass may be greater in black individuals. As a result, the observed activity of the muscle enzymes, creatine kinase and lactate dehydrogenase, are often higher in this group.
- The concentration of some blood constituents varies depending on whether or not the patient is fasting (eg, plasma glucose and triglycerides rise after the ingestion of food). Blood samples for lipid testing should only be collected after the patient has fasted for 12 to 14 hours.
- A patient’s state of nutrition can also affect results (eg, undernutrition is usually associated with low albumin concentrations).
- Physical activity can have both short-term and long-term effects on the concentrations of various substances in the blood. After physical exertion, there can be changes in the concentration of trace elements, enzymes, lipids and hormones. Long-term physical training can lead to reductions in creatinine, glucose and mean cell haemoglobin and basal serum enzyme activities of creatine kinase and lactate dehydrogenase are often elevated in athletes.
- When a patient changes from lying to sitting or standing, the consequent reduction in plasma volume (change in hydrostatic pressure results in the flow of water into interstitial spaces) will increase the concentration of various substances such as albumin, bilirubin, calcium and cholesterol.
Influence of drugs on test results
An important consideration in interpreting laboratory test results is the influence of any medicines the patient is taking. An obvious example is iron supplements increasing serum ferritin levels.
Drugs can affect test results either directly or indirectly. Directly, drugs can produce a toxicological or pharmacological effect, leading to a test result that is different from one that would be produced if the patient were not taking the medicine. Laboratory tests that are commonly altered by drugs include those measuring electrolytes levels (eg, bendroflumethiazide can cause hypokalaemia, hypomagnesaemia and hyponatraemia and trimethoprim can cause hyperkalaemia). Haematology and liver function test results can also be affected. For example, women taking oral contraceptives have lower levels of serum folate (due to impaired folate metabolism)1 and the use of rifampicin or angiotensin-converting enzyme inhibitors can alter liver function test results. Similarly, many drugs (eg, terfenadine and thioridazine) can cause variation in electrocardiogram results2 and the use of co-trimoxazole has been reported to increase serum creatinine levels.3
Indirectly, drugs can influence laboratory results by interfering with the testing procedure. For example, doses of vitamin C over 1g can cause false positive urine glucose results with analyses using cupric sulphate (eg, Clinitest) or glucose oxidase (eg, Clinistix). Therefore, the possibility of drug interference should always be borne in mind as a possible explanation for an otherwise unexplained test result.
Care with words
When talking about tests and test results, using the term “normal” implies that any concentration outside the stated range is abnormal and, therefore, unhealthy. Pharmacists need to be aware of the anxiety this might cause to patients. Indeed, some clinical laboratory scientists say that the term “normal” should not be used in relation to results expressed quantitatively. The term “reference” is preferred because there is no clear-cut distinction between normal and abnormal concentrations of any constituent in blood or urine.
Action: practice points
Reading is only one way to undertake CPD and the Society will expect to see various approaches in a pharmacist’s CPD portfolio.
- Look at the section on the influence of drugs on test results and try to work out some of the mechanisms behind the examples given.
- Look at the test kits you stock or use in your pharmacy. What indicators of predictive value are there?
- Find out more about clinical microbiology testing. What factors affect the antibiotics prescribed in hospitals?
Evaluate
For your work to be presented as CPD, you need to evaluate your reading and any other activities.
Answer the following questions: What have you learnt? How has it added value to your practice? (Have you applied this learning or had any feedback?) What will you do now and how will this be achieved?
References
- Shojania AM. Oral contraceptives: effect of folate and vitamin B12 metabolism. Canadian Medical Association Journal 1982;126:244–7.
- Symanski, JD, and Gettes, LS. Drug effects on the electrocardiogram: a review of their clinical importance. Drugs 1993;46:219–48.
- Dijkmans BAC, van Hooff JP, de Wolff FA, Mattie H. The effect of co-trimoxazole on serum creatinine. British Journal of Clinical Pharmacology 1981;12:701–3.

