Introduction
In early 2008 the pharmacy department at Musgrove Park Hospital (a district general hospital in Taunton, Somerset, and part of the Taunton and Somerset NHS Foundation Trust) was experiencing delays to inpatient dispensing. These delays were becoming more acute because of an increasing dispensing workload which was projected to rise by 20 per cent by the end of the year.
The department (consisting of 44.8 whole time equivalent staff) provided a typical range of services, including licensed chemotherapy and sterile production, clinical pharmacy, medicines information and dispensing for outpatient clinics, 650 acute beds and a further 430 non-acute beds. The main dispensary routinely dispensed 600 to 850 items while providing 600 to 700 stock items daily.
Outpatient prescription waiting times varied from a few minutes to 30 minutes, depending on prioritisation of other work; any work required to be delivered to off-site units had the highest priority so as not to miss transport. The time ward nursing staff had to wait for dispensed medicines ranged typically from two to five hours and was increasing. Dispensary staff gradually worked longer hours to complete the day’s work and both ward and dispensary staff began to complain.
Reallocating additional staff to the dispensary coupled with unstructured efforts to improve matters (through increased ‘hard work and diligence’) had been marginally effective but difficult to sustain. By early 2008, median prescription times (the time taken to dispense an item once received in the dispensary) exceeded three hours and daily dispensing times were highly variable. This situation developed despite the partial automation of the dispensary in October 2006 with the introduction of two dispensing robots.
The decision to begin a project to reduce waiting times in June 2008 was made after the chief pharmacist attended a five-day course focusing on improving clinical systems using a range of Lean and other techniques. The principal aim was to reduce average inpatient prescription dispensing times to less than one hour without increasing staffing levels, dispensing error rates or adversely affecting patient safety. The secondary aim was to be able to close the pharmacy at 5.30pm each week day.
Method
The project was regarded as an audit of current dispensary practices and, therefore, ethical approval was not required. All relevant staff were briefed about the intended aims of the project and about how it would be approached and then relevant staff were recruited. Baseline data were collected. Average daily prescription times were obtained automatically from the legacy stock control system and plotted on a chart. These data were then used as the main indicator of progress of the project. Reported dispensing errors were already being monitored routinely via the trust’s clinical incident reporting system.
A process map of the entire dispensing process and associated activities was then constructed.[1]
This involved describing the journey of a single prescription in detail, starting at the point it was written by the prescriber and ending when the dispensed item arrived on the ward to be put away by nursing staff in the correct location (Panel 1). Staff who participated in constructing the process map were encouraged to describe what actually happened in practice. No reference was made to any existing standard operating procedures. Any identified waiting times were regarded as a defined step in the overall process. Related “sideline” processes were also mapped. These included how the dispensary was opened each day and how activities such as stock rotation, stock issues, compliance aid preparation and Controlled Drug dispensing were integrated into the daily dispensary routine. The process map focused on the main workload of the dispensary, which was straightforward original pack dispensing.
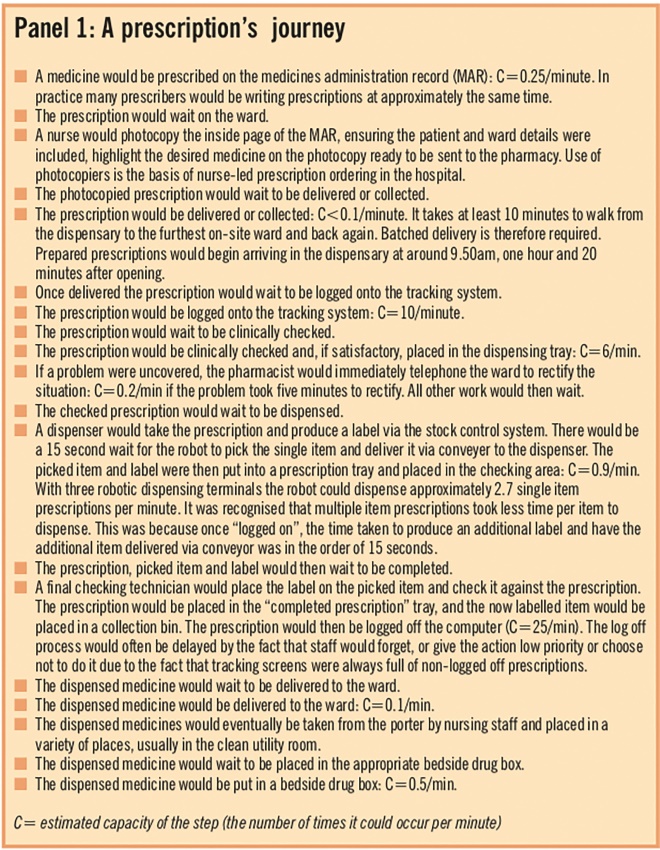
Panel 1: A prescription’s journey
The capacity of each step in this process map (how often the step could be undertaken per unit time) was estimated. The purpose was to identify any capacity mismatches between concurrent steps and hence bottlenecks or impediments to efficient working.[1]
The resulting process map was then further evaluated by value mapping[2]
and failure mode and effects analysis.
Value mapping
Value mapping involved scrutinising each step in the process and asking why it was necessary to perform that step and whether it could be done differently or removed from the process. The chief pharmacist acted as the group member asking the questions. This served two purposes: it brought the group together reliably and also reduced the tendency of others within the group to avoid answering questions that were potentially professionally challenging. When apparently unnecessary steps were identified, they formed the basis of some of the subsequent tests of change.
Failure mode and effects analysis
Failure mode and effects analysis (FMEA) was undertaken after completion of the process map. Each process step was reviewed in terms of reliability and the consequences of it failing. A full FMEA was not undertaken, but the principles behind the technique were used to identify less safe and unreliable practice with a view to performing tests of change.
In this way a variety of “wasteful” or unnecessary steps within the process were identified. These included unnecessary waiting and prioritisation, avoidable interruptions, batching and capacity mismatching. Further consideration was given to these factors and a list of proposed changed were developed.
These proposed changes were intended to minimise the impact of factors identified as contributing to long dispensing times.
The impact of each proposed change was then assessed in a controlled way using the technique of “plan, do, study, act” (PDSA) rapid cycle tests of change.[3]
The results of the tests were documented and objectively assessed by the group. Successful tests of change were immediately implemented. Unsuccessful tests were abandoned. This testing process soon revealed a range of useful visual key performance indicators (KPIs) that became used to supervise dispensary processes (Panel 2). These KPIs were incorporated into routine dispensary supervision and used to give dispensary staff immediate feedback on how the modified process was performing at any given time.
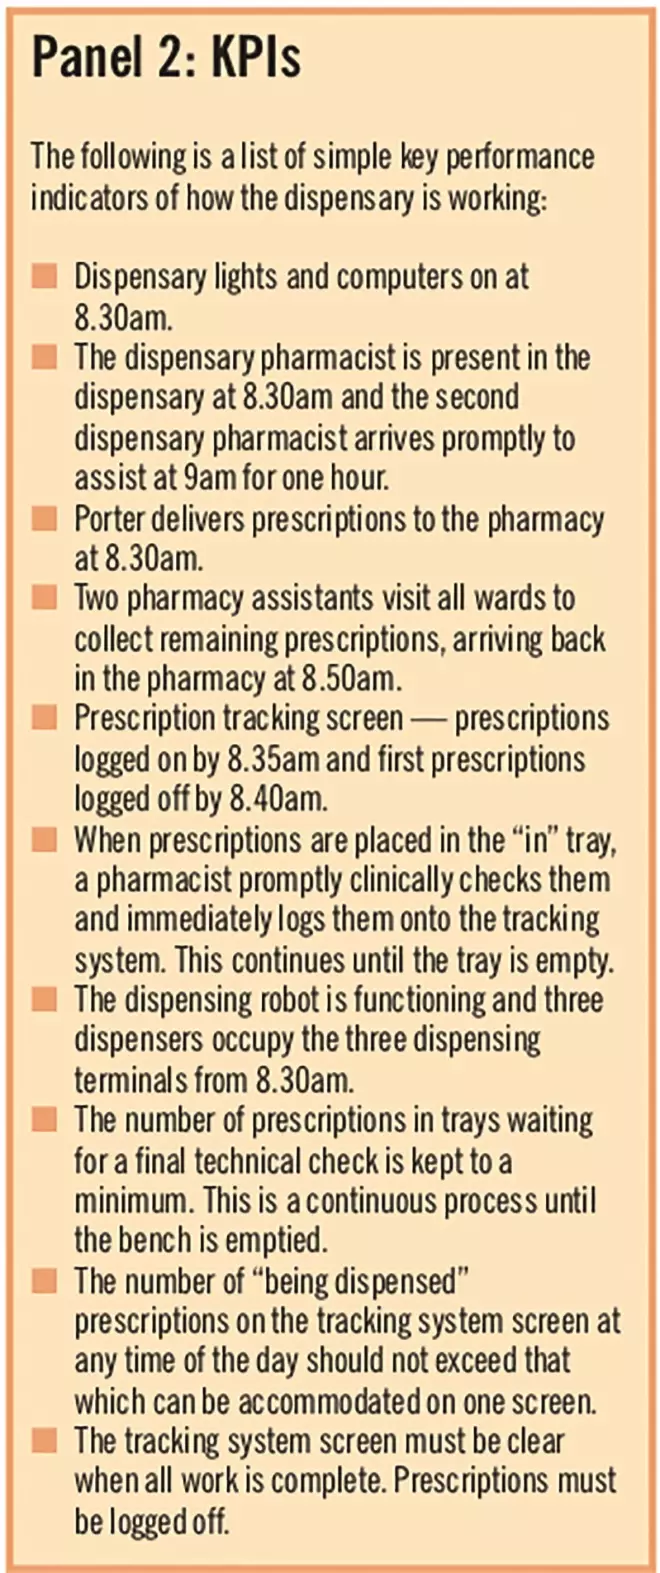
Panel 2: KPIs
The impact of implementing the changes (Panel 3) was monitored through daily average dispensing times that in turn were plotted on charts together with daily workload statistics.
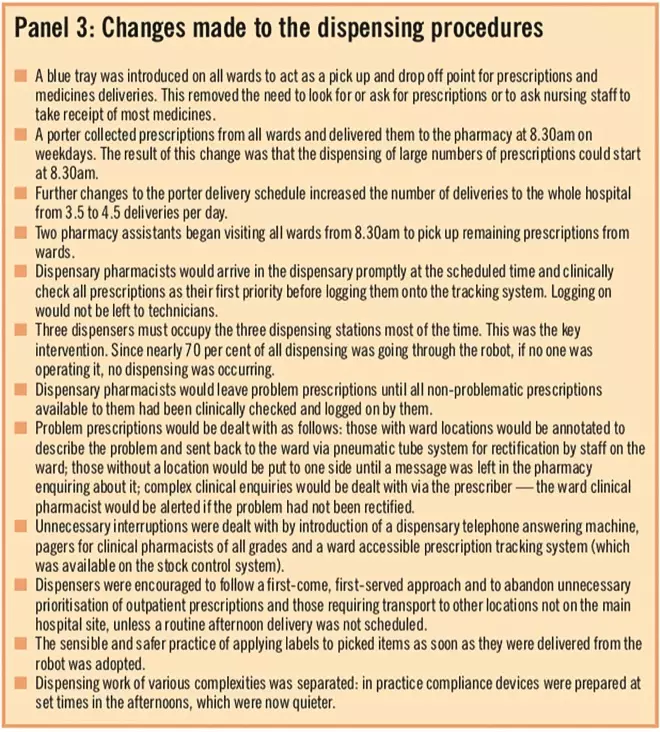
Panel 3: Changes made to the dispensing procedures
Eventually they formed process control charts amenable to statistical analysis.[4]
Following implementation of successful changes the “new” dispensing process was significantly different (Panel 4).
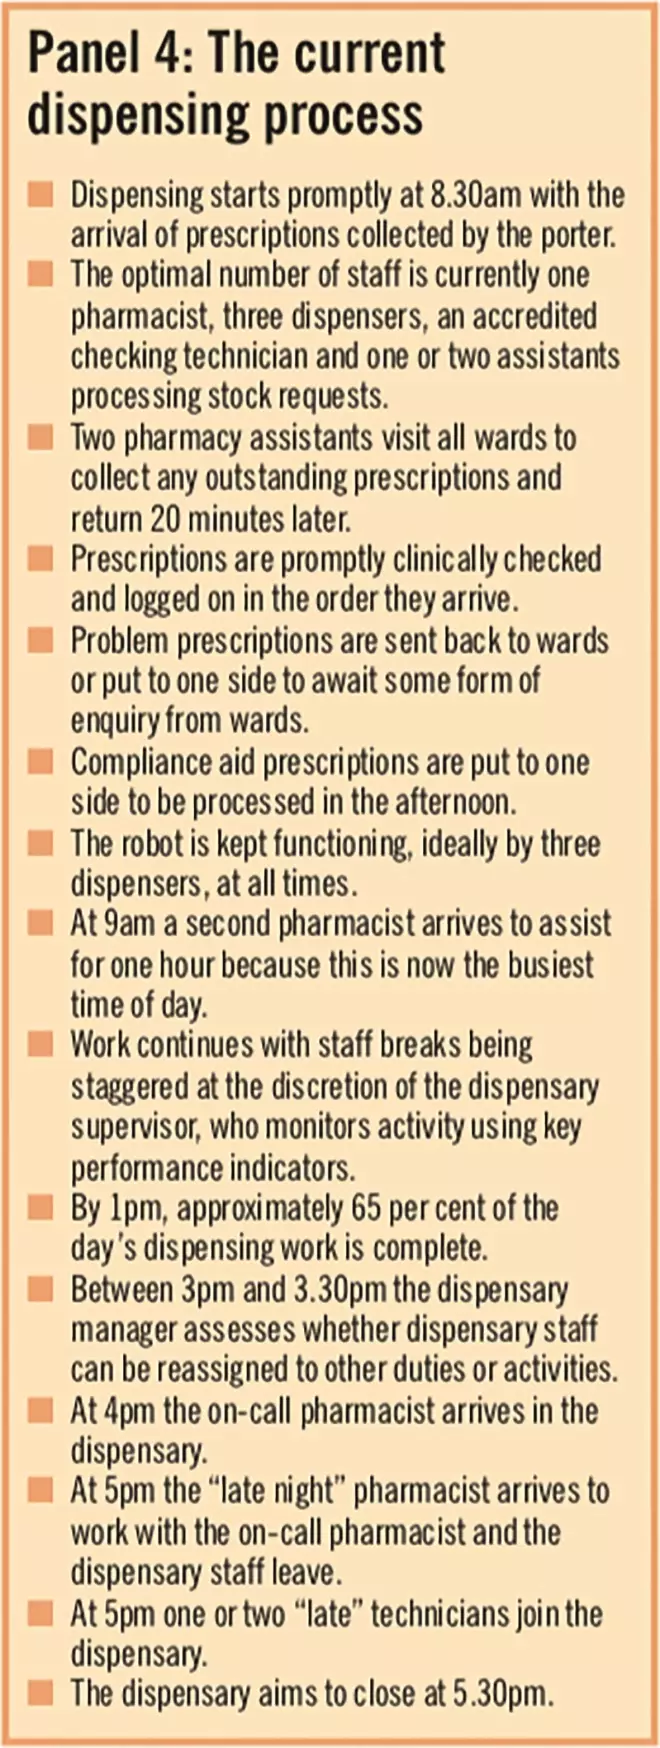
Panel 4: The current dispensing process
Results
Following process changes, baseline median prescriptions times fell from 188 minutes to 27 minutes (standard deviation = 7min) in a stepwise fashion (Table 1) and were sustained thereafter. Sixty-five per cent of daily work was completed before 1pm. The dispensary closed at 5.30pm on Mondays to Fridays. No dispensing errors associated with the pharmacy department were reported during the change period.
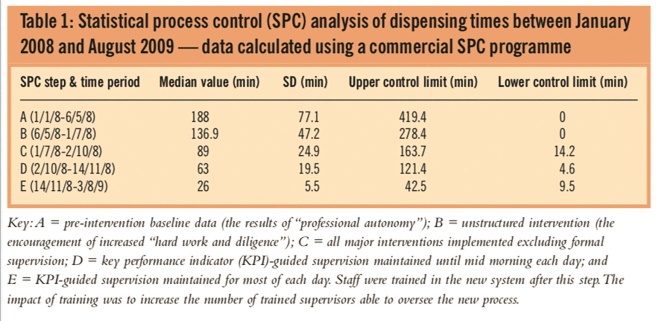
Table 1: Statistical process control (SPC) analysis of dispensing times between January 2008 and August 2009 — data calculated using a commercial SPC programme
Discussion
These results were obtained while the overall dispensing workload increased by 17 per cent in the 12 months following the start of the project.At the same time the results show that average daily dispensing times did not correlate with daily dispensing workloads. Rather, variability in daily dispensing times appeared to be more a function of the composition of the dispensary team on that day, with some staff combinations being faster, while others were slightly slower. One clear factor essential to efficient dispensary procedures was shown to be structured supervision, without which dispensing times were significantly higher.
There was no appreciable increase in departmental costs as a consequence of making these changes. One small cost included the acquisition of a telephone answering machine. The project has resulted in staff cost savings as the need to pay overtime or award lieu time is markedly reduced by the fact that the dispensary now closes at around 5.30pm.
The introduction of changes posed few problems. The main challenge was trying to change pharmacy staff behaviour and beliefs. Many staff initially believed that no improvement would be possible without an increase in dispensary staffing levels.At the end of the project, relatively fewer staff were required to operate the dispensary efficiently. Also some staff initially believed that they were simply expected to work harder. This belief was quickly dispelled. Some pharmacists were initially unwilling to send incomplete prescriptions back to the ward or prescriber. This required intervention from the chief pharmacist, who then clarified the benefits of the new practice.
Many ward staff objected to the introduction of the dispensary answer machine. The argument for introducing it was that it was analogous to the nurses “do not disturb” tabard. Opposition was overcome by ensuring that messages were checked every 30 minutes and a call log kept. Eventually all pharmacists were equipped with a bleep so that ward staff could contact their clinical pharmacist in cases of emergency. To reduce reliance on telephones further all ward clerks were trained in how to use the prescription tracking system.
There are other advantages to the new dispensary model. Planning staffing levels between departmental units is easier. Predictable changes in dispensary work patterns make it possible and indeed desirable to reallocate dispensary staff to other activities in the afternoons. It is now easier to allow staff to take time off in the afternoons when requested.
Further work is required to address the continuing problem of when exactly to dispense compliance aids and Controlled Drugs. Reallocation of staff to other duties in the afternoons needs to be routine to maintain efficiency.
Conclusion
This project demonstrates the usefulness of using established, industrial change management techniques to assess systems and processes in a healthcare environment.
Equally it demonstrates that implementing simple, structured changes aimed at improving workflow and removing wasteful activities can be highly effective in reducing long dispensing times in an acute hospital dispensary without increasing staffing levels or compromising patient safety.
Acknowledgements
We thank Christine Hart and the dispensary staff of Taunton & Somerset NHS Foundation Trust for their willing support and co-operation during this project. We also thank Paul Blew for technical support.
About the authors
Jon Beard, MSc, MRPharmS, is chief pharmacist and Damian Wood, MPharm, MRPharmS, is lead pharmacist in surgery and critical care at Musgrove Park Hospital, Taunton & Somerset NHS Foundation Trust.
Correspondence to
Jonathan Beard, Chief Pharmacist, Pharmacy Department, Musgrove Park Hospital, Taunton, Somerset TA1 5DA (e-mail jon.beard@tst.nhs.uk)
References
[1] Damelio R. The basics of process mapping. London: Taylor & Francis, 1996.
[2] Rother M, Shook J. Learning to see: Value stream mapping to add value and eliminate muda (edition 1.3). Cambridge, Massachusetts: Lean Enterprise Institute, 1999.
[3] Deming, W E. Out of crisis. Cambridge, Massachusetts: MIT Press, 1989.
[4] Benneyan JC, Lloyd RC, Plsek PE. Statistical process control as a tool for research and health care improvement. Quality and Safety in Healthcare 2003;12:458–64.