Abstract
Aim
To compare prescribing costs of non-dispensing and dispensing doctors, to ascertain significant differences in the use of specific categories of drugs and to identify other factors contributing to differences in overall prescribing costs.
Design
Quantitative analyses.
Subjects and setting
All 25 practices in West of Cornwall Primary Care Trust, categorised into dispensing or non-dispensing practices.
Results
There was no significant difference in aggregated prescribing costs for dispensing and non-dispensing practices, although dispensing practices had significantly higher costs for drugs used for musculoskeletal disorders and had larger savings available from increased use of generic drugs. Two variables from the set of independent variables were significantly associated with the variation between practices in their prescribing costs. These were the percentage of new drugs cost and the Index of Multiple Deprivation. This model explained 37% of the variability in average prescribing costs.
Conclusions
This analysis does not support the commonly held view that prescribing costs per patient for dispensing practices are substantially greater than for patients belonging to non-dispensing practices. Practice prescribing costs were positively associated with the percentage of new drugs prescribed and negatively associated with decreasing deprivation.
Primary care trusts in England are grappling with the promotion of cost effective prescribing in an era of national policy guidance that encourages greater use of medicines. These national policies (eg, national service frameworks, National Institute for Health and Clinical Excellence guidance, the Quality and Outcomes Framework) are just some of the most recent driving factors that are thought to influence GP prescribing behaviour and costs. Other potential factors include practice demography,1 deprivation,2 including measures of unemployment rates3 and the low-income scheme index,4 the number of GP partners in the practice,5 patient expectation and demand,6 and other extrinsic factors such as expert opinion, peer pressure, formularies and guidelines, and marketing and sales techniques.7 The dispensing status of a practice is another suggested influence on prescribing behaviour.8 In other countries, the geographical remoteness of a practice has been considered to be an influence on how GPs prescribe.9
In England all GPs prescribe and most of their patients take their prescriptions to a community pharmacy. However, practices accorded “dispensing” status are permitted to dispense the medicines they prescribe to patients living more than one mile from a pharmacy and, as of 2004, 16 per cent of GPs (excluding GP registrars, GP retainers and locums) in England were authorised to dispense prescriptions.10 GPs offering such a dispensing service receive fees and allowances payable from the Department of Health.
At the time of this study, the provision of such a dispensing service was financed by the listed cost of the drug named on the prescription plus an addition proportional to that cost (the “on-cost”) plus a dispensing fee, plus a container allowance. It is the link between the income for a dispensing doctor and what is written on the prescription (drug and quantity) that brings about the potential conflict of interest when GPs both prescribe and dispense.11 The potential influence that dispensing status may have on a GP’s prescribing behaviour and costs has been a topic of recent debate12 and has been the subject of various quantitative analyses.13–15 There is evidence that dispensing practices in Cornwall are different from dispensing practices elsewhere in England in that their prescribing costs appear to be equal to, or slightly less, than those of their non-dispensing counterparts, although the greater use of branded drugs by dispensing practices appears a constant observation.15
Our main aim was to investigate and analyse differences in prescribing costs between dispensing and non-dispensing practices, and to explore the attitudes and beliefs that GPs hold in relation to doctor dispensing. Our hypothesis was that dispensing practices in West of Cornwall PCT have prescribing costs that are similar to those of non-dispensing colleagues (to refute the generally held view that dispensing status is an adverse influence on prescribing behaviour) and that there are identifiable factors associated with dispensing practices that encourage cost-effective prescribing. About 155,000 people live in West of Cornwall PCT, which covers an area characterised by a high proportion of elderly people and some pockets of high deprivation. There are 98 GPs and 25 practices, with 11 of the practices (39 GPs) holding dispensing status, representing about 40 per cent of GPs and approximately 17 per cent of the population.
The study combined a mixture of quantitative research (an analysis of prescribing data), and qualitative research (interviews with individual GPs, both dispensing and non-dispensing). It is the results of the analysis of prescribing data that are presented here. The results of the qualitative research will be submitted for publication in due course.
Method
All 25 practices in West of Cornwall PCT were categorised into dispensing (11 practices) or non-dispensing (14 practices). The quantitative examination of prescribing costs involved an analysis of prescribing data for dispensing and non-dispensing practices for 2002–03. All data were extracted from the Prescription Pricing Authority prescribing toolkit reports. Aggregated prescribing costs were compared across a number of parameters including total costs per weighted population (updated ASTRO-PUs),1 costs per weighted population for specific therapeutic areas (STAR-PUs)16 at British National Formulary chapter level, costs per weighted population for specialist drugs (generally accepted to be drugs normally initiated by a hospital specialist), and potential savings for each practice if their top 20 branded preparations had been prescribed generically. ASTRO-PUs and STAR-PUs are methods of indirectly standardising prescribing cost data using the age and sex of the practice population. Means for the two groups of practices (dispensing and non-dispensing) were computed by aggregating the individual practice values, ie, summing costs for all practices and dividing by the sum of all practices’ ASTRO-PUs to produce an average cost per ASTRO-PU. Standard statistical procedures for the comparisons of means of paired data (chi squared test) were used.
Average prescribing costs across all practices were further analysed using multiple linear regression with dispensing/non-dispensing as an explanatory variable. Other explanatory variables, mainly those previously shown to affect prescribing costs, were also tested (see Panel). The values for these variables were either extracted from the PPA prescribing toolkit or were obtained locally.
Panel: Explanatory (independent) variables used in the multiple linear regression
- Dispensing status
- Index of Multiple Deprivation
- Low Income Scheme Index
- Training practice status
- Number of GP whole time equivalents
- Practice population
- Population per WTE
- Percentage new drugs cost
The variables used included measures of deprivation using the Index of Multiple Deprivation (IMD)17 from 2004, and 2004 values for the low-income scheme index (LISI). The former has seven different domains: income, employment, health and disability, education, housing, environment and crime.
IMD practice values were obtained by linking the residential postcode of individuals registered with the practice to a geographical area (a census super output area) using a geographical lookup table grid and therefore assigning a deprivation score representative of the area in which they live. A deprivation score linked to the residences of all patients registered with a practice can then be calculated. LISI practice values were used as a proxy for poverty because they represent the percentage of registered patients who are exempt from prescription charges because of low income. Other variables were practice training status, number of GP whole time equivalents (WTEs), population size and population per GP WTE, and the percentage of practice drug expenditure on new drugs (ie, being monitored by the Committee on Safety of Medicines, eg, BNF “black triangle” drugs).
A stepwise forward regression was conducted in which variables were entered into the model in steps taking the one that explains the most significant amount of variance first and continuing until the remaining variables did not explain a significant amount of variance. Stepwise models are generally thought to be a better guide to predicting independent variables than models not structured by statistical criteria.
The accuracy of the prediction depends, among other things, upon the strength of the relationship between the dependent and the independent (explanatory) variables. This is measured in terms of the square of the multiple correlation coefficient, ie, the R2 statistic. A maximum value of 1 represents a very strong relationship with all the variation in the data being accounted for by the independent variables, while an R2 value of zero indicates no relationship. In practice, values between 0 and 1 are encountered.
Data were analysed using the Microsoft Excel for Windows package and the Statistical Package for the Social Sciences. Ethics committee approval was not sought as no patient-specific data were analysed.
Results
Aggregated prescribing data (all prescribing, and broken down into the main subheadings of therapeutic areas classified according to BNF chapters, as well as for specialist drugs and generic prescribing savings from the top 20 brands) for dispensing and non-dispensing practices are shown in Table 1.
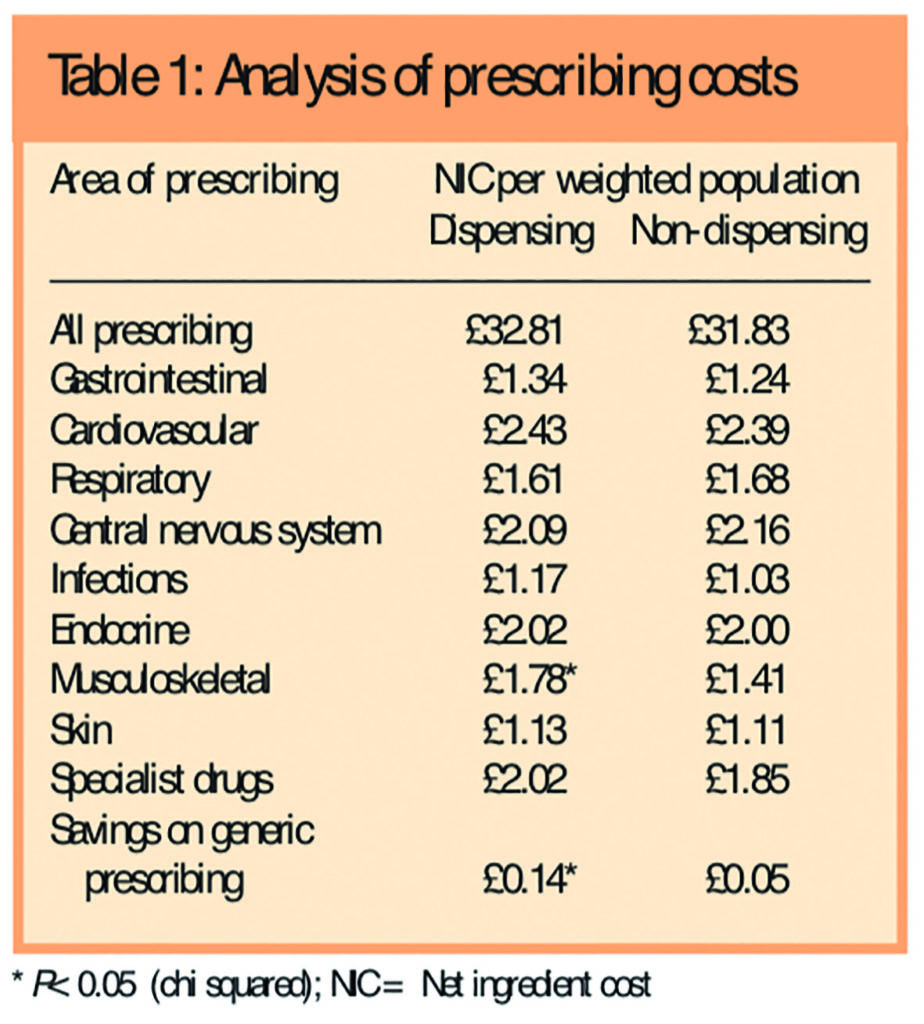
Net ingredient cost per weighted population was significantly higher for dispensing practices (£1.78 per STAR-PU) than for non-dispensing practices (£1.41 per STAR-PU) only for drugs used for musculoskeletal disorders (BNF chapter 10). Savings available from increased use of generic drugs was also significantly greater for dispensing practices (£0.14 per ASTRO-PU v £0.05 per ASTRO-PU).
The results from the linear multiple regression analysis (data not shown) using all the explanatory variables explained 63 per cent (adjusted R2 value) of the variability in average prescribing costs. In the main, expected associations between the explanatory variables and average prescribing costs were apparent. A reduction in prescribing costs was significantly associated with rising values of IMD (and therefore decreasing deprivation) (P=0.017), with an increase in the number of GP WTEs (P=0.006), and with the ratio of population per GP WTE (P=0.017). Higher average prescribing costs were significantly associated with larger practice populations (P=0.004) and with the percentage of new drugs cost (P=<0.001). There was no significant association between prescribing costs and whether the practice was a dispensing or a training practice.
The results of the stepwise forward regression model (data not shown) demonstrated that two of the independent variables were significantly associated with the variation between practices in their prescribing costs, and this model explained 37 per cent of the variability in average prescribing costs. The first of these was the percentage of new drugs cost (P=0.001) — as the proportion of new drugs prescribed increased so did the average prescribing cost for the practice. The second significant variable was the IMD (P=0.039), where increasing values of the variable (and therefore decreasing deprivation) were associated with declining costs.
Discussion
Unlike most other previously published studies, this analysis does not support the commonly held view that overall prescribing costs for dispensing practices are greater than for patients belonging to non-dispensing practices. This is illustrated by a non-significant difference in the mean cost values of 98p per weighted patient. Significant differences (higher values for dispensing practices) were seen only for drugs used for musculoskeletal disorders and in savings available from increased use of generic drugs. The latter finding is not unexpected and has been reported previously.15 Greater use of branded rather than generic non-steroidal anti-inflammatory drugs by dispensing practices may be a contributing factor to the higher costs for drugs used for musculoskeletal disorders, as may the increased use of newer more expensive NSAIDs. Further detailed prescribing analysis is required to confirm these assumptions.
The effect of the number of doctors within a practice on prescribing costs is fairly complex. The number of doctors within a practice has associations with the volume of prescribing18 and previous work has demonstrated a positive influence on prescribing costs from an increasing number of doctors per patient.19 This fits in with our analysis that included all variables where we saw lower costs associated with the ratio of population per GP WTE, ie, as the number of patients per WTE increases, prescribing costs fall. If we assume the opposite also applies (ie, a decreasing number of patients per WTE is associated with higher prescribing costs) then this is explained by patients having access to an increasing number of GPs, allowing the patient more time with the GP and resulting in higher prescribing costs. Although we also saw that prescribing costs tended to fall as the number of GP WTEs increased, it is important to note that this is the absolute number of WTEs as opposed to a ratio of patients per WTE.
The stepwise model, which explained 37 per cent of the variability in average prescribing costs, suggests that for each one per cent increase in the proportion of prescribing costs accounted for by new drugs, there is an estimate of £1.23 increase in average prescribing costs. Prescribing of new drugs is a major driver in prescribing costs, and variability in GP prescribing of new drugs appears to relate not only to levels of acquired knowledge about the drug but also to differences in subjective and ideological beliefs.20 Drug company representatives are seen as an important source of information about new drugs for GPs, and it has been suggested21 that GPs who see drug representatives tend to be those who are isolated from their colleagues and to work in deprived areas.
For each unit increase in IMD (and hence decreasing deprivation) we saw a decrease in average prescribing costs of £2.23. This is an expected association in that it can be postulated that material deprivation causes increased morbidity, which in turn causes increased prescribing costs if the morbidity is detected and treated. A measure of material deprivation should therefore be positively associated with prescribing costs12 (we saw decreasing costs with decreasing deprivation), although deprivation has not always been reported as being associated with higher prescribing.22,23 A greater understanding of this pattern would be achieved by exploring the distinctive contributions of the various domains within the IMD.
Limitations of the study include categorising practices as “dispensing” no matter what proportion of the practice population was registered as dispensing patients. It is not clear if there are substantial differences in the way dispensing doctors prescribe for their dispensing patients as opposed to their non-dispensing patients. In other words, when practices dispense for only a small percentage of their practice list, is there a clear delineation in how the two groups of patients (dispensing and non-dispensing) are treated?
Analysis conducted at the level of general practice (eg, prescribing costs) is difficult when also using measures of deprivation for a super output area (eg, IMD) because of the necessary assumptions about how patients distribute themselves among practices. A deprivation measure that is assigned to a group of people (eg, a general practice population) is only an aggregate measure of the experience of that group and any single individual within that group may experience a different level of deprivation. Hence an association seen at the group level (eg, with prescribing costs) may therefore not apply at the individual level. (Assuming it does apply is known as the ecological fallacy, defined as a situation that can occur when a researcher or analyst makes an inference about an individual based on aggregate data for a group.) There are recognised limitations in using LISI as an independent variable in that this measure only records the low-income status of the population receiving dispensed medicines, and does not consider the status of the population not receiving medicines. Hence there might be an expectation that an index score derived from prescribing data would have a strong correlation with volumes of prescribing. We also note that the number of GPs in this data set was based on routinely collected information that may not include accurate information on part-time GPs or GPs in training.
In addition, it is recognised that the prescribing picture is complex, and many things, including patient demographics, practitioners’ approach to diagnosis and treatment, and the medicines they choose to prescribe contribute substantially to variation in prescribing costs. Explanatory regression models can be difficult to interpret when only some of the many possible influences are included, especially as these influences are so often correlated, eg, the tendency of different deprivation measures to be highly related. Those variables that are included may be acting as surrogates for others that have not been considered. Hence the major conceptual limitation of all regression techniques is that one can only ascertain relationships, but can never be sure about underlying causal mechanism and there may be “multicolinearity”, the effects of which are difficult to gauge in studies of this sort.
This small study is restricted to just one PCT in Cornwall and Isles of Scilly with data collected for just one year, and it is acknowledged that doctor dispensing occurs in only a small number of primary care trusts across England. However, recent national policy issues, such as the introduction of category M prices within the Drug Tariff have the potential to influence dispensing doctor prescribing behaviour, and changes to how dispensing is reimbursed and remunerated were introduced in April 2006 with the aim of removing the direct link between income and that which is written on the prescription. The potential consequences of doctor dispensing have warranted investigation and consideration at both national and international level, with studies investigating considerations of both a financial nature and impact on quality of care.24
Acknowledgements
This research was funded by a South West Area Research Movement small project grant. We thank Pat Owen, public health scientist, Cornwall & Isles of Scilly PCT, for her statistical advice and help.
This paper was accepted for publication on 16 November 2006.
About the authors
Michael Wilcock, MRPharmS, is head of the prescribing support unit, Cornwall and Isles of Scilly Primary Care Trust (Central Cornwall PCT at the time of the study).
Jo Erwin, PhD, is honorary research fellow, Peninsula Medical School, Truro.
Jan Wankowski, MSc, is prescribing analyst, Cornwall and Isles of Scilly PCT (West of Cornwall PCT at the time of the study).
Correspondence to: Michael Wilcock, Pharmacy Department, Royal Cornwall Hospitals NHS Trust, Truro TR1 3LJ (e-mail: mike.wilcock@centralpct. cornwall.nhs.uk)
References
- Roberts SJ, Harris CM. Age, sex and temporary resident orientated prescribing units (ASTRO-PUs): new weightings for analysing prescribing of general practices in England. BMJ 1993;307:485–8.
- Foster DP, Frost CEB. Use of regression analysis to explain the variation in prescribing rates and costs between family practitioner committees. British Journal of General Practice 1991;41:67–71.
- Pringle M, Morton-Jones A. Using unemployment rates to predict prescribing trends in England. British Journal of General Practice 1994;44:53–6.
- Lloyd DCEF, Harris CM, Clucas DW. Low income scheme index: a new deprivation scale based on prescribing in general practice. BMJ 1995;310:165–9.
- McCarthy M, Wilson-Davis K, McGavock H. Relationship between the number of partners in a general practice and the number of different drugs prescribed by that practice. British Journal of General Practice 1992;42:10–12.
- Stevenson FA, Greenfield SM, Jones M, Nayak A, Bradley CA. GPs’ perception of patient influence on prescribing. Family Practice 1999;16:255–61.
- Prosser H, Almond S, Walley T. Influences on GPs’ decision to prescribe new drugs — the importance of who says what. Family Practice 2003;20:61–8.
- Morton-Jones TJ, Pringle MAL. Prescribing costs in dispensing practices. BMJ 1993;306:1244–6.
- Cutts C, Tett SE. Influences on doctors’ prescribing: is geographical remoteness a factor? Australian Journal of Rural Health 2003;11:124–30.
- Department of Health. Statistics for General Medical Practitioners in England: 1994–2004. Bulletin 2005/02. London: Department of Health Publications; 2005.
- Minister stands by statement on dispensing doctors’ “conflict of interest”. Pharmaceutical Journal 1992;249:84.
- Watkins C, Harvey I, Carthy P, Moore L, Robinson E, Brawn R. Attitudes and behaviour of general practitioners and their prescribing costs: a national cross sectional survey. Quality and Safety in Health Care 2003;12:29–34.
- Dunn CDR, Beswick DT. Some (more) thoughts on dispensing from surgeries. Pharmaceutical Journal 1993;251:739–40.
- Baines DL, Tolley KH, Whynes DK. The costs of prescribing in dispensing practices. Journal of Clinical Pharmacy and Therapeutics 1996;21:343–8.
- Wilcock M. Dispensing doctors and non-dispensing doctors — a comparison of their prescribing costs. International Journal of Pharmacy Practice 2001;9:197–202.
- Lloyd DCEF, Harris CM, Roberts DJ. Specific therapeutic group age-sex related prescribing units (STAR-PUs): weightings for analysing general practices’ prescribing in England. BMJ 1995;311:991–4.
- Office of the Deputy Prime Minister. The English Indices of Deprivation 2004 (revised). London: ODPM; 2004.
- Baker D, Klein R. Explaining outputs in primary care: population and practice factors. BMJ 1991;303:225–9.
- Rice N, Dixon P, Lloyd DCEF, Roberts D. Derivation of a needs based capitation formula for allocating prescribing budgets to health authorities and primary care groups in England: regression analysis. BMJ 2000;320:284–8.
- Prosser H, Walley T. New drug uptake: qualitative comparison of high and low prescribing GPs’ attitudes and approach. Family Practice 2003;20:583–91.
- Watkins C, Moore L, Harvey I, Carthy P, Robinson E, Brawn R. Characteristics of general practitioners who frequently see drug industry representatives: national cross sectional study. BMJ 2003;326:1178–9.
- Packham C, Robinson J, Morris J, Richards C, Marks P, Gray D. Statin prescribing in Nottingham general practices: across sectional study. Journal of Public Health Medicine 1999;21:60–4.
- McAlister A, Murphy NF, Simpson CR, Stewart S, MacIntyre K, Kirkpatrick M et al. Influence of socioeconomic deprivation on the primary care burden and treatment of patients with a diagnosis of heart failure in general practice in Scotland: population based study. BMJ 2004:328:1110–12.
- Trap B, Hansen EH. Treatment of upper respiratory tract infections — a comparative study of dispensing and non-dispensing doctors. Journal of Clinical Pharmacy and Therapeutics 2002;27:289–98.