Introduction
There are four inhalational anaesthetics available in the UK — halothane, isoflurane, sevoflurane and desflurane — all with different clinical characteristics. Halothane is the oldest, but its use is limited due owing to adverse effects on the liver. Isoflurane is the most commonly used and least expensive agent. Sevoflurane and desflurane are faster acting and have quicker recovery times than isoflurane, but are more expensive: £123/250ml, £58/240ml and £27/250ml respectively.[1]
Desflurane is faster acting than isoflurane with faster emergence and recovery, but is less potent.[1]
Sevoflurane is more expensive than desflurane but is more potent, is rapidly acting and also has faster emergence and recovery.[1]
Therefore, while more expensive than isoflurane, sevoflurane and desflurane are suited to short procedures and have played a central role in the increase in procedures undertaken as day cases. NHS hospitals in England spent over £14m on inhalational anaesthetics in 2006/07 (personal communication, NHS Information Centre) and so it is important that hospitals use the most cost effective choice of anaesthetic agent for the procedure. Furthermore, the introduction of payment by results (PBR), a system by which hospitals are paid a standard price for interventions and procedures,[2]
means hospitals are critically reviewing the cost base for treatment. Similarly, as commissioners of medicines management provision in secondary care, pharmaceutical advisers will be looking for assurances that medicines use is appropriate and not wasteful when compared with other providers.
As part of the NHS financial management system, individual hospital costs for particular procedures or episodes of care (HRGs) are collected by the Department of Health for comparison. These costs are termed reference costs, and have been used by the NHS to performance manage and benchmark their services.[3]
Furthermore, with the advent of PBR and as hospitals move towards foundation trust status, the costs associated with procedures and treatments are being compared with the income through the national tariff. This is service line reporting since it measures the contribution to a trust’s financial position by each of its service lines.
Therefore, it is important for clinicians and managers to understand the components contributing to these costs, including medicines.
Detailed information on medicines use has been available within most hospitals for a number of years, and is used to help promote safe rational and cost effective prescribing through feedback to clinicians and managers.[4]
However, unlike primary care, there is no routine system of comparing hospital medicines usage, since until recently there has been no national NHS dataset of hospital prescribing information. Even if such a dataset were available, we have previously argued that robust comparison of hospital medicines use is confounded by varying size, different levels of activity and case mix between hospitals.[5]
In addition to these differences hospital pharmacy departments use different computer systems to capture cost and usage information at the point of issue to wards, departments and individual patients, which further confounds useful comparison.[6]
A dataset of hospitals medicines usage is collated by IMS Health, a commercial information company, and this dataset covers approximately 95 per cent of hospitals in England.
The purpose of this study was to examine the use of inhalational anaesthetics in hospitals across England using the IMS dataset, to explore whether usage data could be compared for benchmarking purposes.
Methods
Usage data for isoflurane, sevoflurane, and desflurane was provided by the NHS Information Centre, Leeds, sourced from the IMS Health database for the year 2005/06, for each of the former 28 strategic health authorities (SHAs) in England.
Using these data, two analyses were undertaken:
- A comparison of annual usage by actual volume of all inhalational anaesthetics by former SHAs (2003–07 boundaries, NHS England)
- A comparison by volume of the annual usage of short acting inhalational anaesthetics expressed as a proportion of total anaesthetic usage by former SHAs
Halothane was excluded from the analysis since its use was negligible.Analysis of expenditure on inhalational anaesthetics was not undertaken since the cost varies across the country due to different regional contracts being in place. Although isoflurane is supplied in 100ml as well as 250ml bottles, usage was converted into units of 250ml for the purposes of comparison.
Unfortunately the confidentiality agreement between the NHS Information Centre and IMS did not permit release of data down to hospital level.
Results
When we looked at the usage of all three inhalational anaesthetics by former SHAs, no particular trends or patterns emerged. When we combined the usage of the two short acting anaesthetics sevoflurane and desflurane there was is a similarly wide variation, with an 8.8-fold difference from the lowest user (1,378 units) to the highest user (12,095 units). The average consumption of short-acting anaesthetic per former SHA was 5,694 units per year. The distribution of use of short acting anaesthetics, as shown in Figure 1, is skewed towards the lower users, demonstrating a non-normal distribution. However, the median value is only slightly lower than the average at 5,502 units per year.
In order to take out hospital activity as a confounding variable between health authorities the combined usage of short acting
anaesthetics was calculated as a percentage of all inhalational anaesthetics used for each former SHA. This analysis reduced the variability across former SHAs, with the range of percentage use between the lowest users (26 per cent) and highest users (94 per cent) of short-acting inhalational anaesthetics being only 3.5-fold, with an average relative usage of 62.8 per cent. The distribution of this relative usage was also different from raw data being slightly skewed towards the higher end (Figure 2). Therefore, the median value was calculated, which was slightly higher at 66.3 per cent.
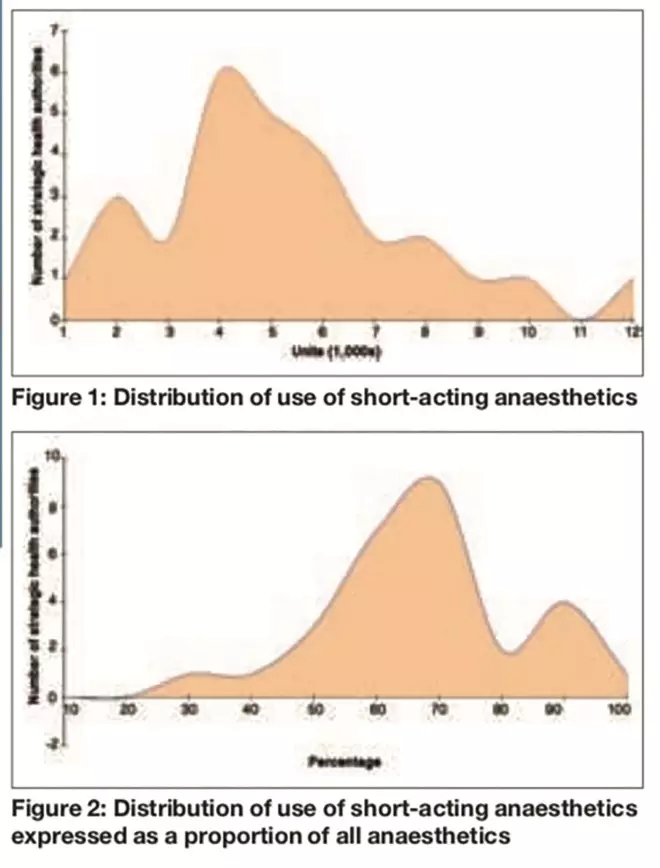
Figures 1 and 2: Distribution of use of short-acting anaesthetics; and Distribution of use of short-acting anaesthetics expressed as a proportion of all anaesthetics
Discussion
Analysis of the raw usage of all inhalational anaesthetic agents showed a wide variation in use across all 28 SHAs. Since it was difficult to see any trends with three individual anaesthetic agents, the combined usage of the two short-acting agents, sevoflurane and desflurane, was analysed and, although less confusing, there was still a wide variation in use of these inhalational anaesthetics. The nearly nine-fold difference between the lowest and the highest use is not remarkable, since there is a wide variation in hospital size and activity across all the former SHAs. However, the large difference in use was surprising because analysis by SHA would be expected to smooth out differences between individual hospitals, indicating that analysis by individual hospital would probably show an even wider variation. When analysis of usage was expressed as a proportion of combined short-acting inhalational anaesthetics and isoflurane a different picture emerged where the difference between the lowest and highest user was only 3.5 fold.
The distribution pattern of short-acting inhalational anaesthetics when expressed as raw usage data was skewed towards the lower end (Figure 1), but when expressed as a proportion of all inhalational anaesthetic use the distribution pattern changes and was skewed towards the higher end (Figure 2). These findings would suggest that analysis of raw usage data tends to underestimate the real usage pattern of short-acting inhalational anaesthetic agents, since it does not take into account hospital activity, which is a major variable in all medicines use.
One particular SHA provided a good example of how the usage pattern changed using the different analyses. The SHA did not appear notable in its use of short acting inhalational anaesthetics, being only slightly above the national average. However, when use is expressed as a percentage of total inhalational anaesthetic use, the same SHA showed the highest proportional use of short acting inhalational anaesthetics nationally.
This study demonstrates that expressing the use of specific medicines in a group as a proportion of total use removes the variables of hospital size and activity because absolute quantities are not involved. By removing these variables a different pattern of use is seen (in this case inhalational anaesthetics) than when raw usage data alone are used. However, this approach can only be applied where there are a number of medicines within a class, but with different cost effectiveness.
We have shown here that this approach removes the variables of hospital size and activity.However, it does not normalise for case mix. As discussed at the beginning of this article the short-acting inhalational anaesthetic agents are particularly suited to short procedures and day cases. The proportionality analysis does not factor in the differences in the number of day cases performed in a hospital. It is known that there is wide variation in the application of day case surgery across the country,[7]
which is influenced by surgical case mix, availability of facilities, and the personal preferences and training of the surgeons. The choice of anaesthetic agent is also an important factor, since judicious use of short-acting anaesthetic agents can improve hospital productivity by facilitating more cases per theatre session.
Using Prescription Analysis and Cost data, primary care trusts have been able to compare GP prescribing practice against national and local averages.[8]
However, in order to make these comparisons meaningful the local population health status expressed as AstroPUs[9]
is taken into account. Therefore, in a similar manner, if the use of inhalational anaesthetics is to be compared in a meaningful way then any analysis must also take into case mix issues such as day case activity as well as overall hospital size and activity.
Conclusion
This study has shown that comparison of raw anaesthetic use, even at SHA level, shows wide variation and is of little value due to the confounding factors of variations in hospital size, activity and case mix. Comparing the use of short acting inhalational anaesthetics as a proportion of total inhalational anaesthetic use reduces this variation significantly by removing the size and activity variables. However, before meaningful comparison of hospital use of inhalational anaesthetics can be undertaken the difference in hospital day case activity also needs to be factored in. Having such a system would be particularly useful as it would allow trusts to compare themselves against other hospitals or national/SHA averages in much the same way as GPs can compare their prescribing. If a trust were an outlier through over or under use of short acting anaesthetics then pharmacists could explore with clinicians underlying reasons and opportunities for change.
Acknowledgements
The authors thank the NHS Information Centre Leeds for providing hospital anaesthetics usage data at strategic health authority level.
About the authors
R. W. Fitzpatrick, PhD, FRPharmS, is clinical director of pharmacy at Royal Wolverhampton Hospitals and professor of pharmacy ay Wolverhampton University.
R. G. Pate, MCPP, FRPharmS, is secondary care pharmaceutical adviser at Keele University.
Correspondence to: Professor Fitzpatrick at Pharmacy Department, McHale Centre, New Cross Hospital, Wolverhampton WV10 0QP
(e-mail ray.fitzpatrick@rwh-tr.nhs.uk)
References
[1] Inhalational anaesthetics. In: British National Formulary (no 58). London: BMJ Group/RPS Publishing, 2009; p701.
[2] Department of Health. Reforming NHS Financial Flows. Introducing Payment by Results. London: Department of Health, 2002.
[3] Department of Health. Reference Costs 2006/7. London: Department of Health, 2008.
[4] Fitzpatrick RW, Mucklow JC, Fillingham D. Managing medicines in secondary care: a comprehensive system. Pharmaceutical Journal 2001;266:588–9.
[5] Fitzpatrick RW, Pate RG. Hospital prescribing: a taste of each other’s medicine. Health Services Journal 2008;(13 Nov):28–9.
[6] Walker D. Prescribing information in secondary care — the value of a national database. Pharmaceutical Journal 2000;264:262–5.
[7] The Acute Hospitals Portfolio review of findings. Day Surgery. London: The Audit Commission, 2001.
[8] Jones MI, Greenfield SM, Jowett S, Nayak A, Stevenson FA, Bradley CP. Monitoring prescribing: GPs’ use of Prescription Analysis and Cost (PACT) data. Primary Healthcare Research and Development 2002;3:105–14.
[9] National Prescribing Centre. A short guide to prescribing terms. Liverpool: National Prescribing Centre, 1999.