Introduction
Over the past few years there has been increasing interest in pharmacy workforce patterns, particularly in the columns of The Pharmaceutical Journal. In particular, recent research indicates that pharmacists’ stress levels are higher than average and much of this stress is as a result of increasing workload.[1]
This is not surprising since the number of NHS prescriptions dispensed in community pharmacy has risen from 649.7 million in 2003 to 842.5 million in 2008, a rise of almost 30 per cent.[2]
In the same period, the number of pharmacists on the Register has only grown by 5.2 per cent.[3]
Overall the number of medicines dispensed per head of population grew from 10.5 in 1998 to 16.4 in 2008.[2]
Hospital pharmacy is also affected by increasing workload owing to the rise in the number of medicines used per patient, and also because patients admitted to hospital tend to have more complex problems than those managed in the community. This is compounded by the increasing pressure on hospital beds and the need to reduce length of stay. In addition, many hospital pharmacy departments are subject to cost improvement/reduction programmes, which require a percentage reduction in baseline costs in order to help trusts achieve financial balance.
The 2009 Budget report announced that the Department of Health in England would be required to make efficiency savings of £2.3bn, and Treasury forecasts issued with the Budget also suggested that the NHS is set for low or zero real growth in funding after 2011.[4]
All of this will place increased pressure on existing hospital pharmacy staffing resources.
Current thinking in the NHS is that such large savings can only be delivered by improved efficiency and innovation.[4]
If hospital chief pharmacists and their management teams are to respond to this challenge they need to be able to assess the current capacity and efficiency of their services. There has been little published on capacity planning in hospital pharmacy. What has been published was over a decade ago[5]
or restricted to the specialised area of cancer services.[6]
The NHS Pharmacy Education and Development Committee undertakes annual workforce surveys on staffing establishments and vacancy rates among hospital pharmacy staff in acute and mental health NHS trusts. The latest survey indicates a vacancy rate of 13.9 per cent among pharmacists and 8.9 per cent among pharmacy technicians,[7]
adding further pressure on staff. This annual survey also captures data on pharmacy workforce staffing establishments but, as has been previously articulated in relation to medicines use, comparing hospitals is difficult, since they vary in size, activity and case mix.[8]
This paper attempts to provide some national benchmarks for hospital pharmacy staffing by linking individual hospital workforce staffing establishment information with activity data for individual hospitals.
Methods
Individual hospital pharmacy staffing establishment data were extracted from the 2007/08 NHS National Pharmacy Education and Development Committee’s “National NHS pharmacy establishment and vacancy survey”, published in May 2008. Hospital activity data for 2007/08 were extracted from the Department of Health hospital episodes statistics website at www.hesonline.co.uk.
For each hospital pharmacy in England the number of full-time equivalent staff (FTE) was divided by the number of admissions for that hospital for that year. The ratio was then expressed as a percentage FTE per admission. Using the workforce data it was possible to calculate the percentage FTE/ admission for pharmacists, pharmacy technicians, and support staff separately. In this paper the title “support staff ” is used to cover pharmacy assistants and administrative and clerical staff.
Acute hospitals were analysed separately from mental health and social care hospitals, since patients in the latter had longer lengths of stay and this would have skewed the data if combined with acute hospital data.
Major national and regional cancer hospitals were also excluded from the analysis since it was thought that they would have unusual staffing profiles due to the high level of labour-intensive aseptic dispensing being undertaken. Teaching hospitals and general acute hospitals were not segregated in the analysis, since it was not always possible to differentiate these from the hospital name, although it is recognised that staffing profiles may be different.
Data analysis was undertaken on 149 acute hospital NHS trusts, and 50 mental health and social care trusts in England. Although workforce data were available for Wales and Northern Ireland there were no corresponding HES data so these were not included in the analysis.
Results
The analysed data for acute hospitals followed a normal distribution pattern. The mean percentage FTE pharmacy staff per admission for acute hospitals in England was 0.114 per cent, range 0.037–0.271 per cent (Table 1). Not only was there considerable variation between hospitals as shown by the large range, but there was also considerable regional variation when the data were analysed by strategic health authority (Table 1).
Analysis was also undertaken of the individual staff group establishments in pharmacy by strategic health authority (Table 2).
The data analysed for mental health and social care trusts did not follow a normal distribution. Therefore, the median value was calculated for each staff group (Table 3). However, the numbers were too small to undertake a subgroup analysis by SHA.
Although it was not possible to undertake detailed analysis of mental health and social care trusts by SHA, a comparison with acute hospital staffing profiles was undertaken (Table 4).
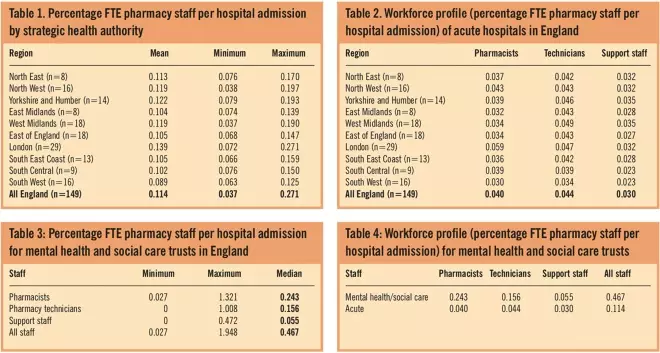
Tables 1, 2, 3 and 4
Discussion
This is the first time national benchmarking of hospital pharmacy staffing establishment levels has been published, providing national and regional profiles. The results demonstrate that there is wide variation of staffing establishments, as shown by just over a seven-fold difference between the lowest and highest numbers (Table 1). Furthermore, the data reveal wide variation between regions with London having the highest levels of staffing and the South West the lowest (Table 1).
Comparisons of the staffing profiles across the SHAs (Table 2) also reveal some interesting differences. London has the highest number of pharmacists per admission, which is not surprising given the number of schools of pharmacy and the fact that London has a high concentration of teaching and specialist hospitals. The higher cost of living in London may also be an influencing factor on staffing skill mix. It should also be noted that London, together with North West and West Midlands had a higher difference (four-fold) between the lowest and highest staffing establishments than most other regions, which was around a two-fold difference.
The South West has the lowest number of all pharmacy staff groups per admission, which is difficult to explain, although the large geographical area of this SHA may be a factor.
The West Midlands had the highest number of pharmacy technicians per admission, and together with Yorkshire and Humber the highest number of support staff per admission. Although pharmacy staff development is supported in most SHAs, my own experience is that in the West Midlands a lot of work has gone into pharmacy technician and support staff development as well as clinical pharmacy programmes.
The comparison of staffing profiles between acute and mental health and social care trusts reveals not unsurprising differences. The four-fold difference in the number of total pharmacy staff per admission in mental health and social care trusts compared with acute trusts (Table 4) probably reflects the longer length of stay in these hospitals. The larger six-fold difference in the number of pharmacists per admission (Table 4) may reflect that fact that in-house pharmacy services to mental health and social care trusts tend to be mainly clinical services with medicines supply provided by a neighbouring acute trust under a service level agreement.[9]
This hypothesis is supported by the lower proportion of, and in some cases, no support staff (Table 3) in mental health and social care trusts, since this grade of staff are involved in supply rather than clinical functions.
There are a number of limitations in this analysis. As mentioned above many acute trusts provide pharmaceutical services to other NHS hospitals such as mental health and social care trusts. Therefore, the staffing levels of these trusts will be inflated by this additional work, which is not reflected in the admission data.
As noted in the results it was not possible to differentiate between district general and large acute teaching hospitals. It is recognised that the case mix between these types of hospital may be markedly different, with the latter having more tertiary specialties, which will impact on the pharmacy staffing levels and skill mix.
Although national and regional cancer hospitals have been excluded, there may be other highly specialised tertiary units within SHAs that may also skew the figures. Where this was known to me, these units have also been excluded from the analysis.
In this analysis the denominator used to normalise the raw data for activity was the number of hospital admissions. Hospital Episode Statistics data also provide activity in the form of finished consultant episodes (FCEs), and occupied bed days. FCEs were not used in this study, since this number could be skewed by transfer between consultants. This would vary between hospitals, and is more likely to occur in the larger teaching hospitals. Occupied bed days were not used since this figure is much larger than admissions and if used as a denominator would have produced very low numbers for comparison purposes. Although number of admissions is only a proxy indicator of pharmacy activity it is not unreasonable to expect more hospital admissions to result in more pharmacy activity both in delivery of clinical services and medicines supply.
Despite the limitations of this analysis, it does provide for the first time, a benchmark of hospital pharmacy staffing establishments in England. It compares pharmacy staffing establishments but does not attempt to consider actual staff in post. This latter analysis is carried out very well by the NHS Pharmacy Education and Development Committee in its annual staffing establishment and vacancy surveys.[7]
Individual hospital staffing data have not been presented here for reasons of confidentiality, but individual chief pharmacists could use their own staffing establishment and hospital admission data to compare themselves against national and regional averages presented here. Such a comparison could help chief pharmacists in the management of their services, particularly in the challenging fiscal environment the NHS now faces.
Acknowledgements
I gratefully acknowledge the work of the NHS Pharmacy Education and Development Committee, which compiles the National NHS Pharmacy Staffing Establishment and Vacancy Survey.
About the author
Ray Fitzpatrick, PhD, MRPharmS, is clinical director of pharmacy, Royal Wolverhampton Hospitals NHS Trust, and professor of pharmacy at Wolverhampton University
e-mail rayfitzpatrick@nhs.net
References
[1] Pharmacist stress levels are rising above the national average as workload increases. Pharmaceutical Journal 2009;282:631
[2] NHS Information Centre Prescribing Support Unit. Prescriptions dispensed in the community. Statistics for 1998–2008: England. Leeds: NHS Information Centre; 2009.
[3] Seston E, Hassell K, Workforce update — joiners, leavers, and practising and non-practising pharmacists on the 2008 Register. Pharmaceutical Journal 2009;282:383–5.
[4] West D. Budget 2009: Improve NHS productivity or cut services – Kings Fund. Health Services Journal, 22 April 2009. Available at: www.hsj.co.uk (accessed 30 April 2010).
[5] Purkiss R. How to get the staff you need. Pharmacy in Practice 1997;7:393–6.
[6] Low J, Macintyre J, McKiver L, Lannigan N. The development of a capacity planning model for pharmaceutical services to cancer patients. Pharmaceutical Journal 2003;270:239–40.
[7] National NHS Pharmacy Staffing Establishment and Vacancy Survey 2009. London: NHS Pharmacy Education and Development Committee, 2009.
[8] Fitzpatrick RW, Pate RG. Hospital prescribing: a taste of each other’s medicine. Health Services Journal 2008;(November 13):28–29.
[9] Healthcare commission. Talking about medicines. The management of medicines in trusts providing mental health services. London: Healthcare Commission, 2007.