Charlotte Gurr
By the end of this article, you should be able to:
- Identify the purposes of systematic reviews and meta-analyses;
- Describe a systematic review and how it is prepared;
- Describe a meta-analysis and its important features;
- Explain the potential problems or biases that can occur with a meta-analysis and how they can be avoided or minimised;
- Identify and assess the strengths and limitations of a published meta-analysis;
- Describe how clinical practice guidelines are best developed;
- Identify good sources for locating systematic reviews, meta-analyses and practice guidelines.
Clinicians should critically evaluate clinical studies to determine how to apply findings to patient care. However, this can be challenging when studies are inconclusive or report conflicting results. Resources that synthesise and interpret findings from multiple studies can help clinicians evaluate the overall body of evidence and guide clinical decisions. These resources include systematic reviews, meta-analysis, which is a special type of systematic review, and practice guidelines. This article will briefly outline the features of these resources, how they can be located and guidelines for evaluating their quality.
Systematic reviews
A systematic review can summarise the current thinking in an area, identify knowledge gaps requiring further investigation, or answer or explore a specific research question. Systematic reviews thoroughly examine the relevant studies in an area using a structured, rigorous and reproducible process. This process includes:
- Clearly identifying the review’s objectives;
- Specifying inclusion/exclusion criteria for the studies to include;
- Thoroughly and comprehensively searching for studies that meet the eligibility criteria;
- Critically examining the strengths and limitations of the studies included and assessing the validity of their findings using clearly stated, explicit methods;
- Formulating conclusions based on the evidence presented.
Meta-analyses
A meta-analysis is a type of systematic review. In addition to the rigorous process used for a systematic review, a meta-analysis statistically (i.e. quantitatively) combines the data from each study to calculate a pooled, overall outcome measure. The steps involved in performing a meta-analysis are analogous to those used for performing a clinical trial — except instead of enrolling individual patients, a meta-analysis incorporates individual studies. The meta-analysis steps include:
- Identifying a clinical problem;
- Developing search strategies to locate relevant studies;
- Developing eligibility criteria for the studies to include;
- Extracting the needed data from each eligible study using independent — ideally blinded — observers;
- Establishing a scale to rate the quality of acceptable studies;
- Determining and charting (with the 95% CI) the difference between the treatment and control groups for each study using a standardised outcome measure;
- Statistically calculating the combined, pooled outcome measure to show the magnitude of the difference between groups.
The combined outcome measure is usually reported for continuous-level data as weighted mean differences or effect sizes (i.e. standardised mean differences [SMDs], defined as the difference in the outcome means between intervention and control groups divided by a pooled SD) and for categorical data as an odds ratio (OR), relative risk (RR) or hazard ratio (HR). Meta-analyses can be found for many clinical topics — for example, performing a PubMed search on a given condition and limiting the article type to ‘meta-analysis’ can yield hundreds to thousands of retrievals.
A cumulative meta-analysis can be thought of as an ongoing meta-analysis. Each time another study is performed that is similar to the others in a meta-analysis, the new study’s results are statistically added. This generates a new pooled outcome measure with a larger meta-analysis sample size. For clinical questions under active investigation, cumulative meta-analyses might identify significant findings more rapidly than a large prospective experimental study. A cumulative meta-analysis can also determine if there are temporal effects on the outcome over time.
What are the benefits of a meta-analysis?
Sometimes, several individual studies have already been performed to examine a clinical question. If these studies were small, they might have had an insufficient sample size and statistical power (see ‘Evaluating study results: statistical inference, hypothesis testing and significance’ for a discussion of power) to show a statistically significant treatment effect. Findings might also disagree, in part owing to small sample sizes. Since a meta-analysis combines individual studies’ results into a pooled, standardised outcome measure, the patients from each small study form a much larger overall sample in the meta-analysis. The benefits of a meta-analysis include:
- Increased statistical power to help resolve disagreements among smaller, individual studies;
- Finding an answer to a clinical question faster than it would take to complete a single study large enough to have the needed power;
- Providing more precise (i.e. accurate) estimates of treatment effects;
- Answering relevant questions not posed at the start of individual studies;
- Enabling conclusions to be generalised to a more varied range of patients;
- Providing the most reliable treatment recommendation in the absence of a large, definitive clinical trial.
Potential problems and biases
Since a meta-analysis is a type of ‘observational’ study, there are several possible problems or biases. These concerns generally involve the following areas: search strategy/study identification, heterogeneity, study quality and presentation of findings. A summary of each area follows.
Search strategy/study identification
A meta-analysis should include all relevant studies so the combined outcome measure accurately reflects the body of literature. Missing important studies could bias the findings. Although most completed studies in a target area are likely published, some investigators might never publish their findings. This could be owing to several reasons, but is of most concern when the decision to publish was influenced by the study’s results. Publication bias occurs when a study is not published owing to its findings (i.e. positive/significant versus negative/nonsignificant) or potential conflicts of interest for investigators. Unpublished studies are less likely to report positive or significant findings, while small or pharmaceutical manufacturer-funded studies are more likely to be published when results are significant. Thus, using only published studies in a meta-analysis can bias findings.
How can one determine if a meta-analysis identified and included as many relevant studies as possible? Bibliographic databases index different journals, so searching only one database will likely miss some studies of interest. To avoid database bias that can occur when only one database is used, the meta-analysis should use several databases (ideally at least two comprehensive resources) and list those searched, such as the National Library of Medicine’s MEDLINE database (e.g. accessed through PubMed or another source) and Embase (Elsevier). Web of Science (Clarivate) also provides access to several databases, including citation indexes that allow one to find related studies that cite the study of interest in their bibliography. To locate unpublished studies, the meta-analysis should also search controlled trial registries (e.g. Cochrane Central Register of Controlled Trials, ClinicalTrials.gov). Professional meeting or conference abstracts should be consulted, along with pharmaceutical manufacturers and investigators with expertise in the subject area.
English-language bias can occur when a meta-analysis only includes English-language studies, since foreign-language studies published in English are more likely to show significant findings than those published in foreign-language journals. This bias can be avoided when meta-analyses do not limit literature searches to English language and include available foreign-language studies.
Once the searching strategy is completed and all possible relevant studies located, which studies should be included in the meta-analysis? Selection bias can occur when only certain studies are picked for meta-analysis inclusion based on factors such as study location, investigators involved, etc. To avoid this type of bias, the meta-analysis should clearly state the pre-determined eligibility (i.e. inclusion/exclusion) criteria used. Two or more individuals should review the studies located to verify eligibility and to extract the needed data for the meta-analysis. Ideally, they should be blinded regarding the location and investigators associated with each study. Multiple publication bias occurs when results from the same study are published in more than one journal. Meta-analyses should check for and remove duplicates. Meta-analyses should also clearly indicate how many relevant studies were originally found, how many were excluded and the reasons why.
Heterogeneity
A meta-analysis assumes that each of the studies being statistically combined are generally comparable, with patient samples taken from the same underlying population. However, all studies will not be the same and could have differences (e.g. patient characteristics, drug doses/dosage forms/administration, treatment duration, study design, outcome measures) that could make them inappropriate to combine in a meta-analysis. While some variability in individual study findings is expected, the differences should not be substantial enough to interfere with the ability to combine data and generalise findings. Therefore, a meta-analysis should measure the extent of variability among the individual studies’ results, which is referred to as heterogeneity, for each outcome of interest.
Testing for heterogeneity can be done statistically, graphically or using a sensitivity analysis. Two statistical methods used to determine heterogeneity include the Cochran’s Q (modified chi-square) test and the I2 statistic. The Cochran’s Q test analyses if significant variation across studies is owed to heterogeneity or to chance (i.e. random error). If the test is statistically significant (i.e. low P value), it is concluded that chance/random error is unlikely to explain any differences and the studies are heterogeneous for that measure. If the test is not statistically significant (i.e. P value > cut-off), no significant heterogeneity is present for that measure among the studies in the meta-analysis. The I2 statistic provides the % of variation in the individual study findings owing to heterogeneity or actual study differences instead of chance. The I2 value ranges from 0% to 100%; the higher the %, the greater the heterogeneity, with 0% = no statistical heterogeneity (i.e. random chance explains any variability in individual study findings). Significant heterogeneity is typically considered present when I2 > 50%.
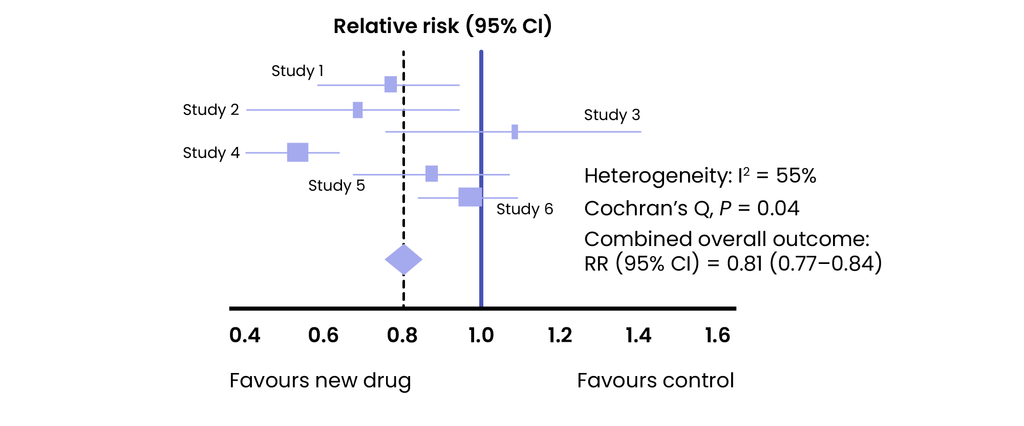
A forest plot is a graphical method that can identify heterogeneous studies. It plots the finding (e.g. mean, OR, RR, etc.) from each individual trial — shown by the squares — with its CI range (see Figure 1). The sizes of the squares reflect the proportional weight given to that study’s finding when the pooled meta-analysis value was calculated. For example, if one study was larger or used a better design than another, that study’s finding might have contributed more to the pooled meta-analysis calculation. At the bottom of the plot, a diamond shows the combined outcome measure for the meta-analysis, with the width representing its CI range. From the diamond, a vertical line is drawn up. If the individual studies are homogeneous, the vertical line will cross through each individual study’s horizontal CI line. In other words, if all studies are homogeneous, the value for the combined outcome measure for the meta-analysis will be included in each study’s CI for that measure. Any studies that do not cross the line from the centre of the diamond (i.e. do not contain the combined outcome measure in its CI range) are considered heterogeneous from the others. A line can also be drawn vertically from the value representing no difference between therapies (i.e. one for RR, HR and OR, and zero for non-ratio differences). If that line crosses the horizontal line for a study (i.e. the value of no difference is in the CI range of the study), the outcome finding in the individual study was not statistically significant.
Figure 1: Forest plot
Worked example 1
A meta-analysis was performed to determine the efficacy of a new antiulcer drug and included six studies that compared the new antiulcer drug to a control proton-pump inhibitor. The risk ratio (RR) was the standardised outcome measure used for ulcer bleeding risk. A funnel plot (see below) of ulcer bleeding from the new drug compared to control was included. The meta-analysis calculated a RR = 0.81 for the pooled outcome measure for ulcer bleeding. Use Figure 1 to answer the following questions.
What does the dashed line indicate?
The dashed line represents the meta-analysis’s pooled RR value for the outcome of ulcer bleeding (RR = 0.81).
Which studies, if any, appear to be heterogeneous?
The dashed line does not cross the horizontal CI ranges for Study 4 and Study 6 — meaning, the pooled meta-analysis RR value of 0.81 is not included in the CI ranges for those studies. These two studies are considered heterogeneous and could contain differences in study design, methods, etc., that make them dissimilar from the others.
What does the solid line represent?
The solid line is drawn from the value of 1 that indicates no statistically significant difference for a RR.
Which studies did not find a statistically significant RR?
Study 3, Study 5 and Study 6 did not report a statistically significant RR for ulcer bleeding with the new drug compared with control. The line representing 1 crossed their individual CI ranges, indicating that the value of 1 (i.e. equal risk of ulcer bleeding in the new drug and control groups) was in each of their CI ranges.
What do the tests for heterogeneity indicate?
The I2 = 55% is greater than 50% and indicates substantial heterogeneity is present. The Cochran’s Q P = 0.04 is statistically significant (less than the usual cut-off of 0.05), indicating that random variability was unlikely to explain differences among the studies. Thus, the forest plot and both statistical tests for heterogeneity are consistent with some heterogeneous studies in the meta-analysis. In its discussion, the meta-analysis should explore possible reasons for heterogeneity found.
A sensitivity analysis in an important method for identifying heterogeneity or other possible biases by examining whether different study characteristics affect the combined meta-analysis result. In a sensitivity analysis, the standardised outcome measure is calculated for subgroups with and without a specified characteristic to see if the finding changes. For example, the pooled outcome measure can be calculated for subgroups with and without certain types of studies included (e.g. small vs. large, observational vs. experimental, single vs. double-blinded, etc.). If there is no bias or heterogeneity, the pooled outcome measure should remain the same in the subgroups. A statistical test can determine if random chance was likely for any differences seen. The smaller the P value, the less likely it is that random variability was responsible and the more likely there was a real subgroup difference for that characteristic.
Study quality
The quality of a meta-analysis depends on the quality of the studies included, or, ‘garbage in = garbage out’. Studies can differ with regard to characteristics that reflect quality, such as small vs. large sample size, published vs. non-published studies, randomised double-blind experimental vs. observational designs, intent-to-treat vs. per protocol data handling, short vs. long follow-up duration, etc. This makes it important for a meta-analysis — or any systematic review — to examine the quality of the individual studies included. One method for determining study quality is to use a tool or checklist to assess the bias risk, such as the revised Cochrane risk of bias tool. Investigators should provide a summary of the bias assessment for each study included. Meta-analyses will often ‘weight’ the contribution of studies to the calculated pooled outcome measure based upon their quality, with better designed, higher quality or larger studies given greater weight during the calculation. Another method for identifying possible biases in a meta-analysis is to run sensitivity analyses on the studies included —as described previously — and compare the findings for the standardised outcome measure between subgroups to determine where potential differences in quality exist.
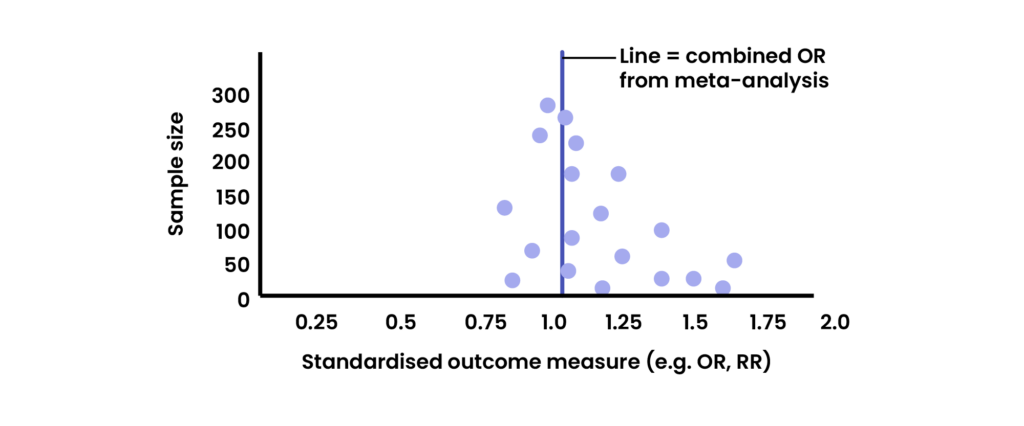
A technique for detecting different biases (e.g. publication bias, any biases related to sample sizes) in a meta-analysis involves the funnel plot. A funnel plot graphs (i.e. plots) the standardised outcome measure (e.g. OR, RR, effect size, etc.) from each study in the meta-analysis (i.e. x-axis) against its sample size or another measure reflecting the precision of the study’s finding (e.g. standard error or variance [y-axis]). The resulting graph should resemble an inverted symmetrical funnel if no sample size or publication-related bias is present (see Figure 2). Why? As a study’s sample size increases, its outcome measure should better reflect the actual (population) treatment effect. Thus, the outcome measures from the larger studies would likely be at the top and clustered around the calculated value for the overall, combined meta-analysis (shown as the mid-point of the graph), while the outcome measures from the smaller studies (closer to the bottom of the graph) should be more widely scattered around both sides of the midpoint. If publication or another bias related to sample size is present, the outcome findings from the smaller studies can be skewed (i.e. asymmetrical) in one direction that likely represents an overestimate of the treatment effect, with a ‘gap’ present (see Figure 3). A funnel plot might also be shown as a triangle (base at the bottom), with the two upward sides of the triangle representing 95% CI limits. With this plot, any studies represented by dots that fall outside the triangle’s CI limits can have potential biases.
Figure 2: Funnel plot — no bias
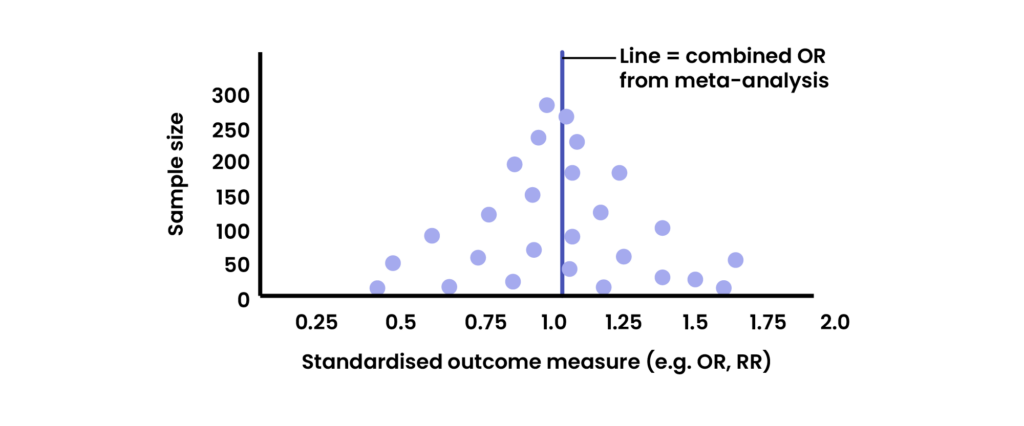
Figure 3: Funnel plot — evidence of bias
In addition to evaluating the quality of individual studies, there are tools available for evaluating the quality of the entire body of evidence used in a systematic review or meta-analysis. One instrument commonly used to assess the quality of evidence at the outcome, not individual, study level is Grading of Recommendations Assessment, Development and Evaluation (GRADE). The GRADE tool rates the overall quality of evidence for an outcome as high, moderate, low or very low (for more information about GRADE, refer to Siemieniuk R 2022)1. To evaluate the overall quality of a systematic review or meta-analysis, clinicians can use a 16-item instrument, A MeaSurement Tool to Assess systematic Reviews (AMSTAR-2), that requires simple yes, no or partial yes responses to each item (for more information about AMSTAR-2, refer to Shea BJ 20172).
Presentation of findings
Meta-analyses present their findings in a standardised, pooled format. When continuous-level data are presented as effect sizes or SMDs, the investigators should provide clinicians with guidance regarding how these SMDs can be interpreted in actual practice (i.e. what is a clinically meaningful or relevant SMD?). Categorical standardised outcome measures (e.g. OR, RR, HR, etc.) are interpreted in the usual manner.
Network meta-analyses
A traditional meta-analysis only includes studies that directly compare two therapies. By contrast, a ‘network meta-analysis’ is designed to examine the comparative efficacy of multiple therapies at the same time. A network meta-analysis includes both direct evidence consisting of randomised controlled studies directly comparing two therapies, as well as indirect evidence in which the efficacy of other therapies of interest are assessed through a common comparator. For a simple example, suppose investigators wish to conduct a meta-analysis of the comparative efficacy of three inhalers for asthma, Inhaler X, Inhaler Y and Inhaler Z. However, studies that directly compare Inhalers X and Z are not available. A network meta-analysis would include the direct studies comparing Inhaler X and Inhaler Y, and, Inhaler Y and Inhaler Z. In the absence of other direct comparisons, it would indirectly examine the comparative efficacy of Inhaler X and Inhaler Z through their effects on the common comparator, Inhaler Y. A network meta-analysis allows conclusions to be made about the comparative efficacy of therapies not directly studied, and it provides evidence for which therapy might be best. A network meta-analysis has the same possible types of biases as a traditional meta-analysis. As might be expected, the conduct of and statistical analyses needed for a network meta-analysis are also more complex compared to a traditional meta-analysis.
Table 1: Sources for locating systematic reviews and meta-analyses
Practice guidelines
Clinical practice guidelines are widely available for most medical conditions and healthcare topics and can be valuable resources for busy clinicians. The Institute of Medicine, which is now the National Academy of Medicine, defined clinical practice guidelines as “statements that include recommendations intended to optimise patient care that are informed by a systematic review of evidence and an assessment of the benefits and harms of alternative care options”. (Institute of Medicine, Clinical Practice Guidelines We Can Trust 2011) Clinical practice guidelines provide recommendations for the diagnosis or treatment of specific medical conditions that can be broadly applied to the patients targeted. The potential benefits of clinical practice guidelines include:
- Describing expected outcomes from therapies;
- Assisting in clinical-decision making by individuals or organisations — they are not meant to be ‘blindly’ followed without consideration of the circumstances affecting individual patients;
- Reducing unnecessary or inappropriate use of tests, procedures, treatments or other healthcare resources;
- Reduced healthcare costs;
- Improved quality of patient care regardless of location by reducing variability in regional standards of practice.
Ideally, clinical practice guidelines should be regularly updated with the most current literature and include a consensus of experts’ opinions. Clinical practice guidelines can be developed by various sources, including government agencies, professional organisations, managed care providers, insurance companies and other third-party payors, or individual institutions. The methods used for guideline development, the completeness and currency of the evidence incorporated, and the quality of the resulting guideline and its recommendations can be extremely variable. It is recommended that developers of clinical practice guidelines adhere to the following standards to help ensure their guidelines are trustworthy (Institute of Medicine, Clinical Practice Guidelines We Can Trust 2011):
- How the guidelines were developed and funded should be clearly stated and methods used should be transparent;
- Minimise or avoid potential conflicts of interest that might affect the developers’ objectivity;
- Use a multidisciplinary development team that includes patient and consumer representatives from the population affected to obtain broad-based input into recommendations;
- Systematic reviews should only be incorporated if they also meet rigorous standards for preparation;
- Each recommendation should be clearly and precisely articulated and provide the underlying reasoning, including:
- Possible benefits and risks, a summary of the relevant evidence used (quality, quantity, consistency), and how opinions (including differences of opinion) and experience affected the decision process;
- A rating of the level of confidence in the underlying evidence;
- A rating of the overall strength of the recommendation;
- Guidelines should undergo external review by all appropriate stakeholders, with the developers considering all feedback provided;
- Dates should be provided for various steps in guideline development (e.g. publication date, date of systematic review of evidence);
- New, relevant literature should continue to be reviewed following guideline completion with the guideline updated as needed.
The quality of the individual studies used for guideline development should be assessed. A key feature of well-developed clinical practice guidelines includes rating or grading both the quality/strength of the overall body of evidence and the quality of each recommendation made. The GRADE instrument was described previously for meta-analyses as a tool used to evaluate the quality of an overall body of evidence. However, it also is used to assess the strength of each recommendation made. The quality of the evidence used is graded as high, moderate, low, or very low quality, based on the certainty or confidence that the estimated effect represents the true effect. The strength of the recommendations developed are graded as strong recommendation for, weak/conditional recommendation for, weak/conditional recommendation against, or strong recommendation against.
The grading of recommendation strength is not only based on evidence quality but also considers the balance of efficacy and safety, values and preferences of the healthcare provider and patient, and costs. Both grades should be included with each recommendation in a practice guideline so clinicians can assess their confidence in applying the recommendations to patients. Some organisations assign a grade consisting of a number and letter (e.g. 1A, 1B, 1C, 2A, etc.) to represent the combined evidence and recommendation strengths. Guidelines should provide definitions for their ratings used.
Table 2 lists several sources for locating clinical practice guidelines. When healthcare providers, organisations or others locate potentially relevant practice guidelines, the Appraisal of Guidelines for REsearch & Evaluation (AGREE II) instrument, consisting of 23 items rated on a 7-point scale (strongly agree to strongly disagree), can be used to assess their overall quality (AGREE, Advancing the science of practice guidelines).
Table 2: Sources for locating clinical practice guidelines
Worked example 2
You are looking for a systematic review examining the efficacy of antioxidant vitamins to prevent macular degeneration. You locate two reviews:
Review 1: authored by three ophthalmologists who described the use of MEDLINE/PubMed to locate relevant articles on this subject — they then described the strengths and weaknesses of each article and summarised the topic by providing their conclusions.
Review 2: authored by an ophthalmology clinic at a university — they stated their methods for conducting the searches for relevant articles in several databases, outlined the eligibility requirements for the studies included, prepared tables outlining the key features of each study included and rated the quality of each study using a validated rating scale, and rated the overall quality of the evidence upon which each of their conclusions was based.
Which best meets the definition of a systematic review?
Review 2. Structured and well-defined methods were used for each part of the process undertaken.
Multiple databases were used to increase the likelihood of locating relevant studies, a validated scale was used for quality ratings and the quality of the body of evidence was assessed.
Worked example 3
You locate a meta-analysis that examines whether garlic can lower serum cholesterol. Specific eligibility criteria were specified for the studies to include in the meta-analysis and two blinded individuals reviewed the studies for data extraction. Six studies were used that each measured the effects of garlic on low- and high-density lipoprotein cholesterol concentrations. These studies were located by conducting a MEDLINE/PubMed search for relevant literature published in English. Sensitivity analyses showed that the studies included appeared to be homogeneous and the I2 statistic was 15%.
Any biases apparent in this meta-analysis?
Yes. English-language bias (no attempt was made to locate foreign-language studies), publication bias (only published studies were located with the search) and database bias (only one database was used) are concerns. It is not known if multiple publication bias was a problem based upon the information provided.
Were any steps used to minimise potential problems?
Yes. The meta-analysis minimised possible selection bias (by specifying criteria for study inclusion/exclusion and blinding the data extractors) and examined the studies included for heterogeneity (i.e. sensitivity analyses and I2 statistic did not show significant heterogeneity).
Key points
- Systematic reviews, meta-analyses, and practice guidelines can help keep clinicians up to date and provide useful guidance for clinical decisions;
- They should state and use clear, specific, and rigorous methods for their development;
- There are several online resources available for locating these types of publications to address clinical questions;
- While providing valuable information, meta-analyses are also subject to several potential problems and biases that can affect their quality, including:
- Heterogeneity among studies included;
- Selection, publication, English language, database and multiple publication biases;
- Heterogeneity can be examined statistically, graphically and through sensitivity analyses.
How to apply in practice
- Look for a systematic review, meta-analysis, or clinical practice guideline to remain updated on topics of interest or to locate information to address a clinical or research question;
- Critically read and evaluate meta-analyses to determine if they were conducted in a well-defined, rigorous manner with clearly stated eligibility criteria for the studies incorporated;
- Determine if significant heterogeneity, which can limit the ability to form valid conclusions, is present among the studies included in a meta-analysis (i.e. examine forest plots for outlying studies, the I2 statistic, the Cochran Q test or sensitivity analysis findings);
- Ensure that meta-analyses took appropriate steps to limit possible publication, database, selection, multiple publication and English-language biases;
- Well-conducted meta-analyses should generate funnel plots and perform sensitivity analyses to check for potential biases in their studies;
- Determine whether clinical practice guidelines were well-developed and from reputable sources to help inform and guide patient care decisions.
Summary
There are several resources that can help healthcare providers find the answers to clinical questions in an efficient, effective manner. These resources include systematic reviews — of which meta-analyses are a particular type — and clinical practice guidelines. This article reviewed the definition and features of each of these resources and provided several sources to use for accessing them.
Self-assessment questions
Question 1
Which are correct regarding the definition of a meta-analysis or its purposes? Select all that apply.
A: A meta-analysis uses formal statistical techniques as a key part of its analysis.
B: A meta-analysis can help generalise conclusions from individual studies to a more varied range of patients.
C: A meta-analysis combines the results of several independent clinical studies.
D: A meta-analysis is done to provide a detailed analysis of a single clinical trial.
E: A meta-analysis can provide answers to questions that are not posed at the start of individual clinical trials.
Question 2
Briefly define a ‘cumulative meta-analysis’.
Question 3
Is the following statement accurate?
“A meta-analysis has an advantage over other types of studies in that it is relatively free of potential biases.”
Question 4
The investigators who performed a meta-analysis state:
“We used MEDLINE to locate the studies that were included in our analysis. Several different search terms were used when searching MEDLINE to thoroughly locate all relevant articles, including foreign-language studies.”
Based on this statement, is it likely that publication bias was present in this meta-analysis? Yes or no?
Question 5
A meta-analysis of the use of antibiotics to treat acute otitis media included 18 studies and reported that “sensitivity analyses were performed to assess the influence of trial design on the pooled OR reported.”
What do sensitivity analyses refer to here?
Question 6
A meta-analysis was performed to determine if omega-3 fatty acid supplements (OFAs) can reduce the likelihood of a myocardial infarction (MI) and expresses the pooled outcome measure as a RR. The investigators provided a forest plot of the 15 studies included and report a pooled RR = 0.86 for OFA compared with placebo. The forest plot graphed the RR from each of the 15 studies with their 95% CI. Lines are shown drawn up vertically from the x-axis representing the values of 0.86 and 1. Examination of the plot shows that 5 of the studies’ CI lines do not cross (i.e. include) the value of 0.86 and 8 of the CIs do not cross (i.e. include) the value of 1. Both lines cross the CI lines for the remainder of the studies. Based on the forest plot, how many studies appear to be heterogeneous in this meta-analysis? How many of the individual studies did not report statistically significant RR values?
Question 7
The meta-analysis described in the previous question to determine if OFA supplements can reduce the likelihood of an MI also provided an I2 statistic = 68% for the 15 studies included for this outcome measure. How should this I2 value be interpreted?
Question 8
A meta-analysis was conducted to compare the efficacy of a DASH diet to a control diet in patients with hypertension. One of the pooled outcome measures was systolic blood pressure, presented as a weighted mean difference (WMD) from baseline. The meta-analysis provided a funnel plot of the 34 studies included, and it showed the WMD plotted against the sample size of the studies. The resulting funnel plot appeared to be asymmetrical, with the larger studies clustered around the meta-analysis’s pooled WMD (the midpoint of the plot) and the smaller studies bunched to the right (representing greater WMDs), with fewer smaller studies plotted to the left. What problem appears to be apparent from the funnel plot described?
Answer guidance
Question 1
A, B, C, and E are correct. A meta-analysis is a type of systematic review that, in addition to being rigorous and structured, uses formal statistical techniques to quantitatively combine the results of separate (independent), but similar studies, into an overall, combined outcome measure. By doing this, a meta-analysis produces an outcome measure with a sample size beyond that of the individual studies involved. The result is an increased statistical power. Meta-analyses are performed for several additional purposes, including allowing results to be applied to a greater variety of patients than a smaller, separate study might be able to do by itself, and answering questions that an individual study did not consider.
Question 2
A cumulative meta-analysis involves reperforming the meta-analysis each time a new study is identified to calculate a new, combined (pooled) outcome measure. A cumulative meta-analysis can graphically illustrate how an outcome measure becomes more precise (with a narrower CI – refer to the article ‘Evaluating study results: central tendency and variability and confidence intervals‘ for more information about CIs) as the number of patients increases. It can be used to identify statistically significant treatment effects sooner than might be required for a large individual study to be completed.
Question 3
No: this is incorrect. A meta-analysis is ‘observational’ in nature in that it uses the findings from already completed studies to calculate a combined outcome measure statistically. Thus, it is subject to several possible limitations and biases. Consider that each study included in a meta-analysis might differ from the others in a number of important ways, such as study design; use of blinding; dosage, administration, or duration of therapy; the inclusion/exclusion criteria, or outcome measures used. The investigators conducting the meta-analysis might also fail to locate and include relevant studies, which could skew the results in a particular direction.
Question 4
Yes: publication bias can occur when a meta-analysis only includes published studies. Published studies can be more likely to show significant (e.g. positive; favourable) results than unpublished studies. Since MEDLINE was used to locate relevant studies, the investigators limited their meta-analysis to only published studies. The investigators should have attempted to locate unpublished studies by searching for relevant information presented at conferences, consulting controlled trial registries that include published and unpublished sources, such as the Cochrane Central Register of Controlled Trials, one of the databases in the Cochrane Library, or by contacting other investigators in the subject area who might know if any unpublished findings exist.
Question 5
A sensitivity analysis is done to check for possible heterogeneity (i.e. important differences) or bias in a meta-analysis resulting from certain features of the studies included. A sensitivity analysis calculates a combined outcome measure with and without certain types of studies included, to determine if excluding studies significantly affects the outcome measure. In the example described, the sensitivity analysis might first calculate a pooled OR with small studies included, followed by calculating the OR again with small studies excluded, to determine the resulting effect on the OR. If there is no significant effect on the pooled OR by dropping the small studies, it means there was no apparent heterogeneity or bias based on study size. The sensitivity analysis can be repeated in a similar manner for other study design features to determine if any appear to cause significant heterogeneity or bias among the studies used in the meta-analysis.
Question 6
In a forest plot, heterogeneous studies include those whose CI lines do not cross the line representing (i.e. that do not include) the value for the pooled outcome measure calculated in the meta-analysis (RR = 0.86 in this example). Given the information provided, five studies appear to be heterogeneous compared with the other studies in the meta-analysis.
Since 1 is the value representing no difference in the relative risk of an MI for OFA vs. placebo (i.e. the numerator and denominator would be the same if the risk of an MI is identical in both groups), any study that includes 1 in its CI range would have a non-statistically significant RR. Based on the information provided in the example, eight of the individual studies would have non-statistically significant RR values.
Question 7
The I2 statistic provides an estimate of the percentage of variability in the meta-analysis’s studies owing to heterogeneity and not random chance. Significant heterogeneity is usually considered present when I2 is 50% or greater. In this example, the 68% value indicates the presence of considerable heterogeneity among the 15 studies, likely owing to inherent differences within the studies and not to expected random variation in findings.
Question 8
Publication bias or other types of biases that can be affected by sample size could be a concern. The shape of the funnel plot is not described as a symmetrical inverted ‘funnel’, with the small studies spread out towards the bottom of the plot on roughly both sides of the pooled WMD. Publication bias can be seen when not all studies conducted in the area have been published, and unpublished studies were missed in the meta-analysis. This affects a funnel plot because smaller studies in an area tend to be published to a greater extent when they have significant findings, so their results are more likely to be skewed in a specific direction.
Acknowledgements
This article was adapted from Drug Information and Literature Evaluation, Second Edition, previously published by Pharmaceutical Press.
A full list of resources and materials used to prepare the book can be accessed from the bibliography page.
- 1.R S, G G. What is GRADE? BMJ Best Practice. Accessed October 14, 2026. https://bestpractice.bmj.com/info/evidence/learn-ebm/what-is-grade/
- 2.Shea BJ, Reeves BC, Wells G, et al. AMSTAR 2: a critical appraisal tool for systematic reviews that include randomised or non-randomised studies of healthcare interventions, or both. BMJ. Published online September 21, 2017:j4008. doi:10.1136/bmj.j4008