Charlotte Gurr
After reading this article, you should be able to:
- Indicate when one-tailed versus two-tailed statistical tests should be used;
- Define parametric tests and describe the main features of the following commonly used parametric tests: t-tests and analysis of variance;
- Define nonparametric tests, when they should be used and the main features of the following commonly used nonparametric tests: Chi-square, Fisher’s exact, McNemar, Mann–Whitney U, Wilcoxon signed-rank, Kruskal–Wallis and Friedman.
This article is part of a comprehensive series exploring how to evaluate clinical studies when addressing information needs using a five-step process:
- Identifying study type or design;
- Appraising the journal, authors and study purpose;
- Critiquing the methods used;
- Analysing study data and results, and the discussion section;
- Understanding basic statistical tests.
This article explores the fifth step: Understanding basic statistical tests. It is recommended that you read it in conjunction with the article ‘Understanding correlation, regression, and survival analysis’.
The interpretation of a clinical trial’s findings usually depends upon the statistical analyses of the data generated in the trial. Statistics help the investigators — and readers — determine whether any group differences found in the outcome measures were likely to have resulted from the treatments.
Many statistical tests are available for this purpose. Their selection depends upon the types of data and specific conditions involved. This article reviews several commonly used statistical tests, focusing on their application rather than mathematical calculation.
One-tailed versus two-tailed tests
Alternative hypotheses to the null hypothesis can be either one-tailed (i.e. an expected direction of the effect is stated) or two-tailed (i.e. a change is expected but it can be in either direction, improvement or worsening). Most clinical studies involve testing new therapies or new uses for established treatments; thus, it is possible that improvement or worsening could occur. As a result, clinical trials generally tend to state objectives (e.g. ‘study is performed to determine if Drug X will improve…..’) or two-tailed hypotheses that do not specify a specific direction of change. The use of one-tailed (i.e. one-sided) or two-tailed (i.e. two-sided) statistical tests depends upon the study’s stated objective and/or hypothesis. A one-tailed or one-sided statistical test should only be used when a study clearly provides a one-tailed alternative hypothesis that an improvement — or worsening — will occur.
Key point
A clinical study should only use a one-tailed hypothesis if the investigators are very confident of the result or have other evidence of a unidirectional change.
Categories of statistical tests
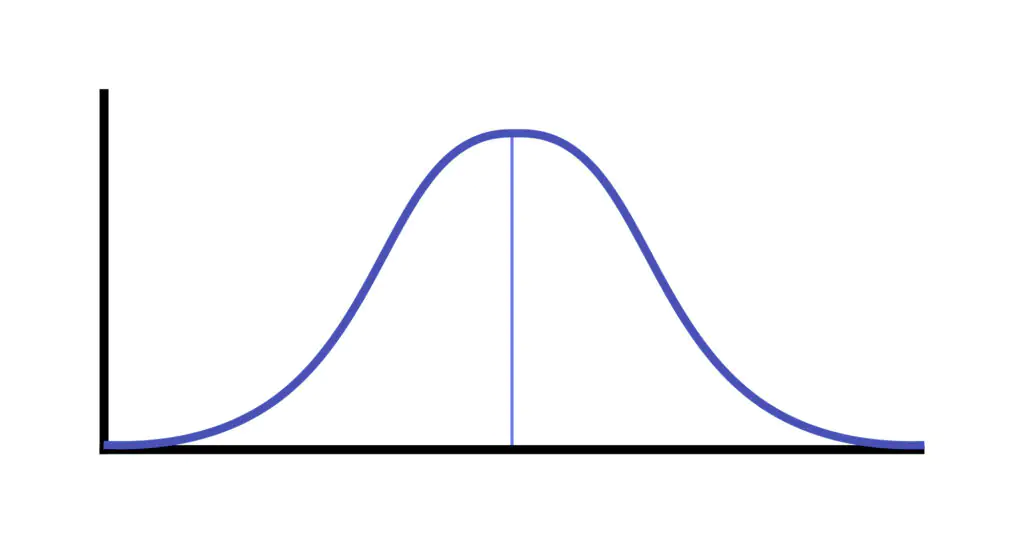
There are two broad categories or types of statistical tests, parametric and nonparametric — each of these categories includes several individual tests. The choice between a parametric or nonparametric test to analyse study data depends upon the assumptions made about the underlying population from which the sample data were selected. Parametric tests are used when the data being analysed are continuous, with the assumption that the underlying population is normally — or near normally — distributed. A normal — also called Gaussian — distribution resembles a bell-shaped curve when graphed by frequency. With a normal distribution, most individual data points are found near the middle, with roughly equivalent numbers of data points lying on each side of the midpoint, with decreasing numbers seen as one moves further from the midpoint (see Figure 1).
Figure 1: Normal distribution (bell-shaped curve)
Key point
Three primary factors should be considered when selecting a statistical test or determining whether one was used appropriately in a study:
- The level/scale of measurement of the data being analysed;
- How many treatment groups are being compared;
- Whether the data are from paired or nonpaired (unpaired) patients.
Nonpaired (i.e. unpaired) refers to data gathered and compared from different patients. Paired refers to data comparisons from the same patient, such as:
- After receiving each treatment in a cross-over or time series study (i.e. the treatments are compared to each other, but the same patients received both treatments);
- Before treatment (i.e. at baseline) and after treatment in the same patients in a parallel, crossover or time series study;
- When patients are matched pairs (i.e. enrolling a patient in one treatment group with a ‘matched’ patient in another group who shares the same characteristics).
For more on this topic see ‘Evaluating clinical study methods: treatment considerations, outcomes, variables and measurements’.
A nonparametric test should be used when the study data are nominal or ordinal-level, with no underlying assumption of normal distribution. Nonparametric tests are also used when at least one of the assumptions for use of parametric tests is violated/not true — most commonly this is when continuous-level data are not normally distributed.
Parametric tests are preferred when appropriate because they have more statistical power than nonparametric tests (i.e. ability to identify a treatment difference as statistically significant if there really is a treatment effect), particularly with relatively small sample sizes.
Parametric statistical tests
Two of the most used parametric tests in the medical literature are the (Student’s) t-test and ANOVA. In addition to the need for continuous, normally — or near normally — distributed data for use of a t-test or ANOVA, two other assumptions exist: population variances are equal — or nearly equal — and the observations or measurements within a population or sample are independent (meaning, the measurement taken from one individual is not influenced by the measurement taken from another person).
For readers of a clinical study, the principal concern with the use of parametric tests in a clinical study is whether the data are normally distributed. Most large data sets will tend to be normally or near normally distributed — smaller data sets can be more of a problem. Tests should be done by investigators to determine if small or other data sets with large variability and outliers are normally distributed.
Readers of a clinical study should generally not concern themselves with whether or not the data from the treatment groups being compared have equal variances (see ‘Evaluating study results: central tendency and variability and confidence intervals’ for a definition of variance). Statisticians should best handle situations of unequal variances.
The assumption of independent observations/measurements is also not of concern in most clinical studies. Data collected from one patient in a control or treatment group would not usually be affected by the data from another person in these studies.
A t-test should be used when the means of only two groups are being compared. There are two types of t-tests: paired (used for comparisons of paired data) and unpaired (used for comparisons of unpaired data). Although ANOVA can be used for a comparison of the means of only two groups (it is essentially the same as an unpaired t-test in this situation), it is usually used for comparisons of means in three or more study groups. There are various ANOVA tests, including one-way, two-way and repeated measures, among others (see Table 1). All these tests are parametric.
Table 1: Common analysis of variance tests
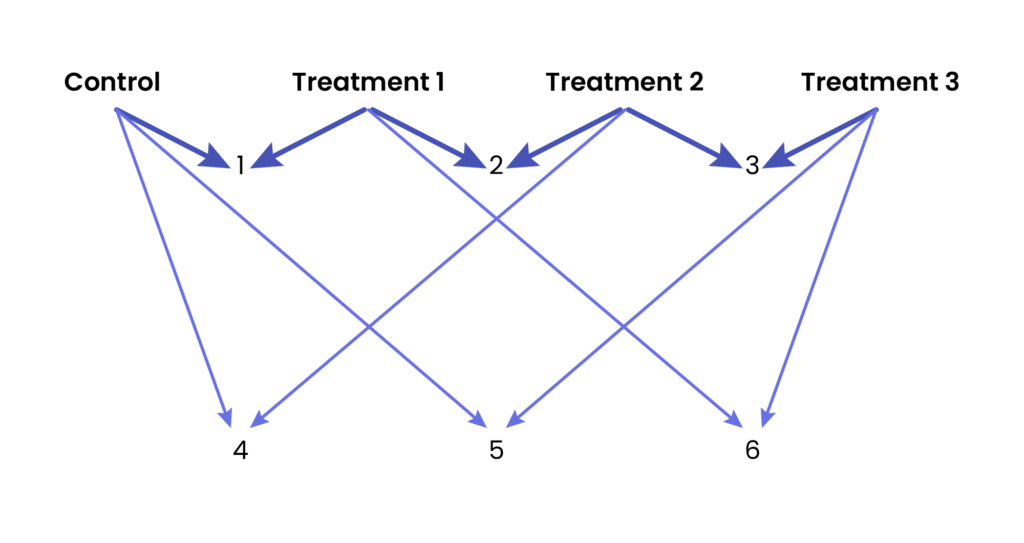
When there are three or more study groups, several individual comparisons are involved with the use of a single ANOVA test (see Figure 2). When ANOVA is used to analyse the difference in means among three or more groups and finds a significant difference, it provides an overall result that does not indicate which of the individual two group comparison(s) is/are statistically significant. A multiple comparison test (also referred to as a ‘post hoc’ test) is used following a significant ANOVA to identify which of the individual two group mean comparisons is/are in fact statistically significant. Some of the more commonly used multiple comparison tests include Scheffe’s test, Tukey’s honestly significant difference (HSD) test, Newman–Keuls test, Dunnett test and the Fisher least significant difference (LSD) test. A Bonferroni correction can also be applied to multiple t-test use.
Figure 2: Example of six individual comparisons made with four study groups
Key point
Is it acceptable to use multiple t-tests instead of analysis of variance (ANOVA) to determine which of the two group comparisons shown in Figure 2 (e.g. control versus treatment 1, control versus treatment 2, treatment 1 versus treatment 2) are statistically significant?
No, unless a specific correction is made. The greater the number of individual comparisons, the greater the risk that through random or chance variability (and not an actual treatment effect) one or more of the comparisons might be found statistically significant (i.e. a Type I error). As an analogy, think of being on a golf course during a lightning storm carrying metal golf clubs. The more holes you play during the storm, the chance of being hit by lightning increases. To help offset the multiple comparison error risk, ANOVA is followed by a specific multiple comparison procedure. In addition, a correction such as the Bonferroni method can be applied to the use of multiple two-group t-test comparisons. The Bonferroni correction reduces the likelihood of finding a significant difference that is not a real treatment effect (i.e. Type I error risk). This correction is acceptable for relatively small numbers of such comparisons but might increase the risk of the opposite occurring — missing real treatment differences/effects (i.e. false negatives – Type II error).
Refer to the article ‘Evaluating study results: statistical inference, hypothesis testing and significance’ for more on this topic.
Worked example 1
A parallel double-blind study is performed to compare the diastolic blood pressures after 12 weeks of therapy in patients randomised to receive enalapril (n=68), lisinopril (n=72), or fosinopril (n=65).
Assume the blood pressure readings are normally distributed.
Which of the following statistical tests should best be used to analyse these data: paired t-test, unpaired t-test, one-way analysis of variance (ANOVA), two-way ANOVA or repeated measures ANOVA?
One-way ANOVA. A t-test should not be used here since there are three groups, not two. There is one independent variable (i.e. drug therapy) so a two-way ANOVA would not be appropriate. Since the groups are unpaired (i.e. parallel design) and the blood pressure is being measured and compared once at the end of 12 weeks, one-way ANOVA is best and a repeated measures ANOVA is not needed.
Worked example 2
A double-blind cross-over study is performed to compare the diastolic blood pressures (BPs) after 12 weeks of therapy in patients with mild hypertension. The patients were randomised to receive either benazepril (n=100), quinapril (n=102), and fosinopril (n= 110) first. After a 2-week washout period, the patients randomly received a second drug. Following another 2-week washout, patients received the therapy they had not yet taken. Diastolic BPs were measured and compared after each 12 weeks of therapy. Assume the blood pressure readings are normally distributed.
Which of the following statistical tests should best be used to analyse these data: paired t-test, unpaired t-test, one-way analysis of variance (ANOVA), two-way ANOVA or repeated measures ANOVA?
Repeated measures ANOVA. A t-test should not be used since there are three groups, not two. A one-way or two-way ANOVA are not appropriate since these tests are used for unpaired data (i.e. parallel design), and these data were paired (the same patients received each therapy using a cross-over design). Further, there is only one independent variable (i.e. drug therapy) which also makes a two-way ANOVA inappropriate. A repeated measures ANOVA is used for comparing values of an outcome, even if not repeated at multiple time points, when three or more treatments are compared using paired data. It is also used for repeated measures being compared at multiple time points using unpaired data.
Worked example 3
A parallel study examined the effects on skeletal muscle markers (e.g. troponin, myoglobin) of three different doses of vitamin D supplements taken to reduce muscle injuries in persons who exercise. Subjects were randomised to receive one of three vitamin D dosages. Since the extent of strenuous exercise — classified as moderate or high — of the subjects would also affect skeletal muscle injury and marker levels independent of the vitamin D dosages, the investigators wished to compare the marker levels from the three vitamin D groups while examining the interactions among vitamin D dosage and exercise extent.
Which analysis of variance (ANOVA) test would be best to use here?
Two-way ANOVA. This is an example in which two independent variables are present — vitamin D therapy (i.e. one independent variable) and exercise extent (i.e. second independent variable). There can be several interactions among these two variables on the outcome measures (i.e. skeletal muscle markers) including low-dose vitamin D–moderate exercise, low-dose vitamin D–high exercise, medium-dose vitamin D–moderate exercise, etc. A two-way ANOVA considers the various potential effects and interactions among independent variables.
Nonparametric statistical tests
There are several commonly used nonparametric tests in practice. The selection of the test to use depends on whether the data being analysed are nominal or ordinal level, the number of groups involved, and whether the data are from paired or unpaired samples. The Chi-square, Fisher’s exact and McNemar tests are among those used for comparing between group differences for nominal level data.
Key point
A rule of thumb is that for a Chi-square test at least 80% of the contingency table cells should have an expected frequency of at least 5. In a 2 x 2 table with four cells (see Worked example 4), 80% of 4 = 3.2. Since this number is greater than 3, all four cells would need to have an expected frequency ≥ 5 to use the Chi-square test.
There is more than one type of Chi-square test. The Chi-square test of proportions is used to compare two or more independent (i.e. unpaired) groups of nominal-level (i.e. categorical) data involving frequencies or proportions. The data are placed in a contingency table with treatments in the rows and outcomes in the columns — each data point in the table constitutes a cell. The Chi-square test compares the values observed in the study with expected values, those that one would expect to see if the treatments had the same effect (i.e. were not different). These values are not necessarily the same as those observed in the cell (see Worked example 4). To use the Chi-square test, the sample size should be large enough so that the expected frequency in each cell is at least 5.
Worked example 4
A study compared the effect of amoxicillin therapy to placebo for treating otitis media. A total of 48 children were studied, with 24 children assigned to receive amoxicillin and the other 24 children assigned to receive placebo. Following 1 week of therapy, 20 children in the amoxicillin group were cured compared to 18 children in the placebo group.
Present these data in the form of a contingency table.
Answer:
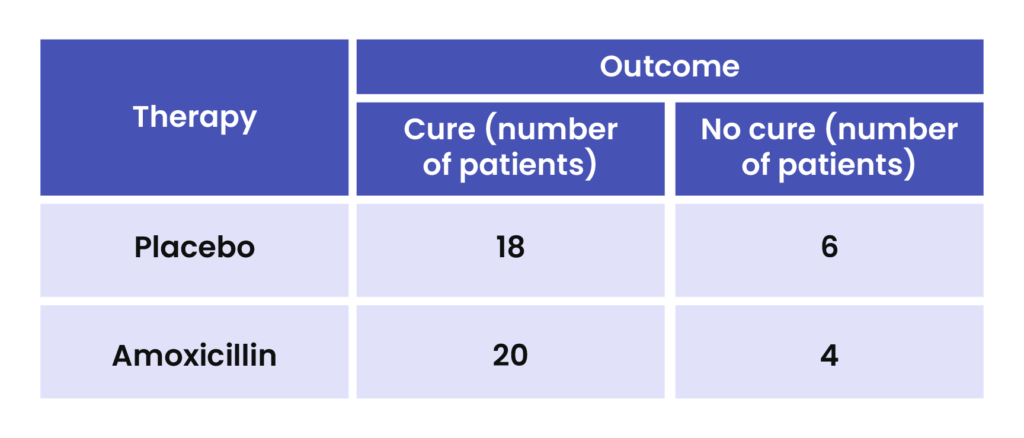
What would the expected frequency be for the Amoxicillin ‘No cure’ cell (row 2, column 2)? Although the number 4 is in this cell, this is not the expected frequency. The expected frequency of this cell = (row 2 total x column 2 total) / N = (24 x 10) / 48 = 24 – 240/48 = 5, which meets the minimum of 5 needed to use the Chi-square test.
If one of the expected values in the cells in a 2 × 2 contingency table is < 5, the Fisher’s exact test can be used. The Fisher’s exact test is used for 2 × 2 comparisons (i.e. two independent groups) of nominal level data when the Chi-square assumption is violated. For comparisons of two groups of nominal level data when the groups are not independent (i.e. for paired data), the McNemar test is used instead of the Chi-square test.
The Mann–Whitney U (also known as Wilcoxon rank-sum), Wilcoxon signed-rank, Kruskal– Wallis and Friedman tests are among the nonparametric tests used for ordinal level data. In addition, these tests can be used as alternatives to the t-test or ANOVA for continuous-level data when one or more of the assumptions for parametric tests are not met. The Mann–Whitney U/Wilcoxon rank sum test is used for comparing two independent (i.e. unpaired) groups; the Wilcoxon signed-rank test is used instead when the two groups are paired; the Kruskal–Wallis test is used for comparing three or more independent (i.e. unpaired) groups; and the Friedman test is used instead when the groups are paired or for multiple (i.e. repeated) measures in patients. The nonparametric counterparts to the commonly used parametric tests are shown in Table 2.
Table 2: Parametric tests and nonparametric counterparts
Worked example 5
For each data description below, match with the statistical test (A–H) beneath that would best be used for its analysis.
Data description
- Comparison of the distance walked in 6 minutes between patients receiving either placebo (102 patients) or sildenafil (125 patients) to treat pulmonary hypertension (data not normally distributed);
- Percentage of patients receiving placebo (40 patients), drug A (59 patients), or drug B (48 patients) who experienced headache or nausea during therapy (no cell frequency< 5);
- Comparison of patients’ ratings of joint stiffness (on scale of 1–4) at baseline and after 3 months of therapy with methotrexate;
- Low-density lipoprotein cholesterol concentrations in patients after receiving atorvastatin (120 patients), simvastatin (129 patients), or lovastatin (135 patients) (data normally distributed, variances equal);
- The effect of a 6-month daily exercise program on sleep time was studied in 120 adults. The time spent in sound sleep was compared at baseline and at the end of the exercise program (data normally distributed);
- Comparison of the FEV1 pulmonary function test results following 12 weeks of therapy with either LABA + inhaled corticosteroid (95 patients) or inhaled corticosteroid alone (102 patients) (data normally distributed).
Statistical test
A. Paired t-test
B. Mann–Whitney U
C. One-way ANOVA
D. Unpaired t-test
E. Kruskal–Wallis
F. Chi-square
G. Wilcoxon signed-rank
H. Fisher’s exact
Answers:
- 1.B. Two unpaired groups; distance walked is continuous level, but assumptions not met for parametric test use;
- 2.F. Three unpaired groups; percentages (i.e. proportions) of patients with headache or nausea are nominal level; sample size sufficiently large for Chi-square use since no cell has a frequency <5;
- 3.G. Two paired comparisons — before and after therapy in same patients; ordinal-level ranked data;
- 4.C. Three unpaired groups; continuous-level data that meet parametric test assumptions;
- 5.A. Two paired comparisons — before and after therapy in same patients; sleep time is continuous level and meets parametric test assumptions;
- 6.D. Two unpaired groups; FEV1 is continuous level and meets parametric test assumptions.
A summary of key points and how to apply the information from this article to practice follow.
Key points
- Table 3 summarises the considerations guiding the selection of commonly used parametric and nonparametric tests;
- The common statistical tests used in clinical studies should be selected to match the data being analysed;
- Two-tailed tests should be used for two-tailed hypotheses or for most study objectives interested in exploring either potential benefits or worsening from therapy.
Table 3: Statistical method selection and use
How to apply to practice
When evaluating the statistical analyses used in a clinical study, consider the following:
- The analysis should be appropriate based on the number of groups, whether the data were paired or unpaired and the level of data involved;
- Parametric tests should be used whenever appropriate;
- T-tests should not be used to analyse three-group comparisons unless a correction such as the Bonferroni correction is employed — analysis of variance is the parametric test preferred for three or more group comparisons;
- If a study uses a nonparametric test for continuous-level data, assume that a parametric test assumption, most likely normally distributed data, was violated.
Summary
This article provided an overview of several important statistical tests often seen in clinical studies. Statistical tests are used to help determine if the study data collected are likely to have resulted from actual treatment effects or differences as opposed to random or chance variability. There are many statistical tests available although several are more frequently encountered than others. Since clinicians will often see these tests reported when reading published trials, it is important to have a basic understanding of why and when they are used.
Self-assessment questions
For each of the types of data comparisons shown in questions 1–9, indicate which of the following statistical tests would be most appropriate to use for its analysis:
QUESTION 1
Number of chemotherapy patients experiencing moderate-to-severe vomiting after receiving a control antiemetic, ondansetron (18 of 58 patients; 31.0%), or a new antiemetic drug (14 of 60 patients; 23.3%) in a randomised study.
A: Paired t-test
B: Unpaired t-test
C: One-way ANOVA
D: Repeated-measures ANOVA
E: Chi-square
QUESTION 2
Comparison of serum haemoglobin concentrations measured each week for a total of four weeks in a randomised, parallel study of patients taking a new IV iron product, an older IV iron product, or placebo (assume data normally distributed, variances equal).
A: Paired t-test
B: One-way ANOVA
C: Two-way ANOVA
D: Repeated-measures ANOVA
E: Chi-square
QUESTION 3
Comparison of body weights at the end of therapy in 68 patients who were randomised to receive one of three antipsychotic drugs for 24 weeks (data normally distributed, variances equal).
A: Paired t-test
B: One-way ANOVA
C: Two-way ANOVA
D: Repeated-measures ANOVA
E: Chi-square
QUESTION 4
Change in body weight from baseline — prior to initiating therapy — to the end of therapy following treatment with an antipsychotic drug for 24 weeks (data normally distributed, variances equal).
A: Paired t-test
B: One-way ANOVA
C: Two-way ANOVA
D: Repeated-measures ANOVA
E: Chi-square
QUESTION 5
Comparison of serum glucose concentrations in patients after receiving dexamethasone or placebo eye drops in a cross-over study (data not normally distributed).
A: Chi-square
B: McNemar
C: Mann-Whitney U
D: Wilcoxon signed-rank
E: One-way ANOVA
QUESTION 6
Comparison of the frequency of dizziness development in patients receiving candesartan or amlodipine to treat hypertension, in a cross-over study of 75 patients.
A: Repeated-measures ANOVA
B: Chi-square
C: McNemar
D: Mann-Whitney U
E: Wilcoxon signed-rank
QUESTION 7
Comparison of visual analog scale (VAS) pain scores at the end of therapy in patients with temporomandibular joint pain randomised to receive either physical therapy alone (18 patients) or physical therapy plus analgesics (19 patients) (data not normally distributed).
A: Chi-square
B: McNemar
C: Mann-Whitney U
D: Wilcoxon signed-rank
E: One-way ANOVA
QUESTION 8
Comparison of the bone marrow density (BMD) scores in postmenopausal women randomised to receive one of two doses of ibandronate or placebo for the treatment of low bone density (BMD scores normally distributed, variances equal). In addition to the effect from the treatment received, the statistical analysis used also included in the analysis the effect of the patients’ baseline BMD (e.g. low, normal) on the outcome measure.
A: Paired t-test
B: One-way ANOVA
C: Two-way ANOVA
D: Repeated-measures ANOVA
E: Chi-square
QUESTION 9
Investigators performed a study to compare the efficacy of two strengths of phenytoin topical cream, 0.5% and 1%, to cream vehicle alone (i.e. placebo) to promote wound healing following the excision of minor skin lesions. Patients were randomised to receive one of the three treatments applied daily for 3 weeks. The change in wound size from baseline to the end of therapy was compared among groups. The study reported that they used ANOVA with the post hoc least significant differences (LSD) method for the statistical analyses.
Was it appropriate for the LSD method to be used here?
Answer guidance
QUESTION 1
E: Chi-square test (assuming no cell has an expected frequency <5); otherwise, Fisher’s exact test — proportion of patients experiencing emesis represents nominal-level data; two independent (i.e. unpaired) groups involved.
QUESTION 2
D: Repeated measures ANOVA — repeated weekly measures of haemoglobin concentrations (i.e. continuous data; meets parametric test assumptions) in unpaired groups.
QUESTION 3
B: One-way ANOVA — three independent (i.e. unpaired) groups, body weights (i.e. continuous data; meets parametric test assumptions).
QUESTION 4
A: paired t-test — two comparisons (i.e. paired — before and after in same patients) of body weight (i.e. continuous data; meets parametric test assumptions).
QUESTION 5
D: Wilcoxon signed-rank test — two groups (i.e. paired, cross-over design with same patients in both group comparisons), serum glucose concentrations (continuous data not normally distributed so cannot use the parametric paired t-test).
QUESTION 6
C: McNemar test — dizziness development (i.e. nominal-level data) in paired groups (i.e. cross-over design with same patients in both group comparisons).
QUESTION 7
C: Mann-Whitney U test — two independent (i.e. unpaired) groups, VAS scores (VAS scales are measures in which patients indicate on a line their extent of pain, and the distance from the end of the line to the mark is measured using a ruler, representing continuous-level data), not normally distributed so cannot use the parametric unpaired t-test.
QUESTION 8
C: two-way ANOVA — three independent (i.e. unpaired) groups; BMD scores (i.e. continuous data; meets parametric test assumptions); the effects of two independent variables (e.g. type of treatment and baseline BMD) on one dependent variable (i.e. BMD score after treatment) are being analysed.
QUESTION 9
Yes: ANOVA is used to compare continuous-level data among three or more groups for which parametric test assumptions apply. If this study finds a statistically significant ANOVA, it would mean that at least one of the group comparisons, placebo versus phenytoin 0.5%, placebo versus phenytoin 1%, or phenytoin 0.5% versus phenytoin 1%, is significantly different. However, it would not indicate which. To identify the between-group differences that are significantly different, one of a number of ‘post hoc’ tests (which means looking at the data after the study is completed and, in this situation, after an ANOVA is performed) is used. Several post hoc tests were identified earlier in this chapter; the Fisher least significant difference (LSD) test is one of those used following a statistically significant ANOVA. If ANOVA was not found to be statistically significant, the post hoc test would not be needed.
Acknowledgements
This article was adapted from Drug Information and Literature Evaluation, Second Edition, previously published by Pharmaceutical Press.
A full list of resources and materials used to prepare the book can be accessed from the bibliography page.