View the print infographic here
Salary
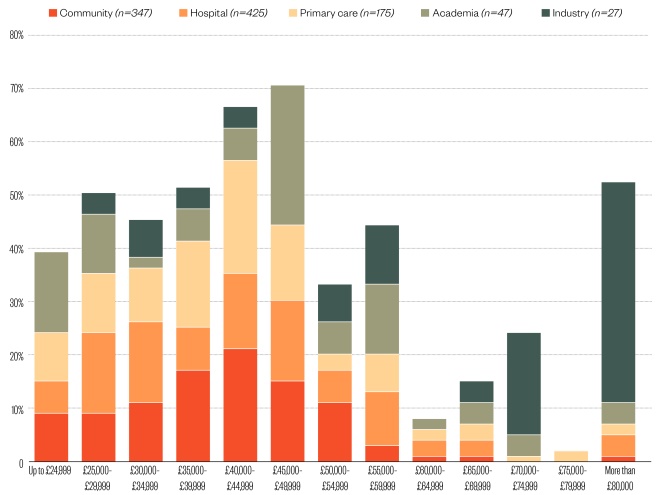
Q: What is your approximate annual salary? (Non-locum pharmacists)
41% of industry respondents earn more than £80,000 compared with only 1% of community respondents
Appropriate pay
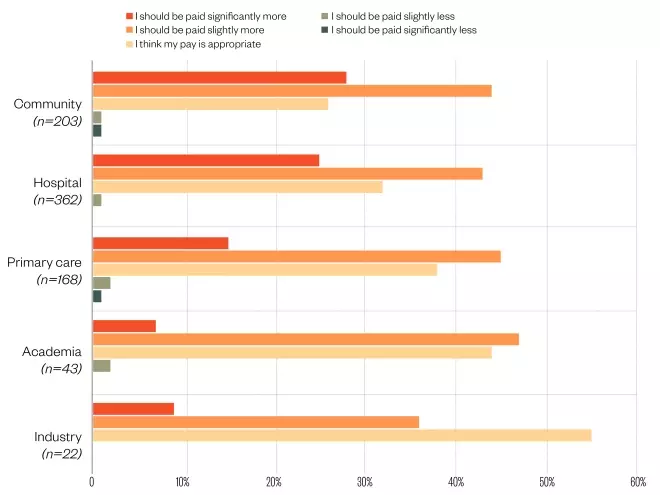
Q: Do you believe your pay is appropriate for the job you do? (By sector)
Most community, hospital, primary care and academia respondents thought they should be paid more
Pay rise
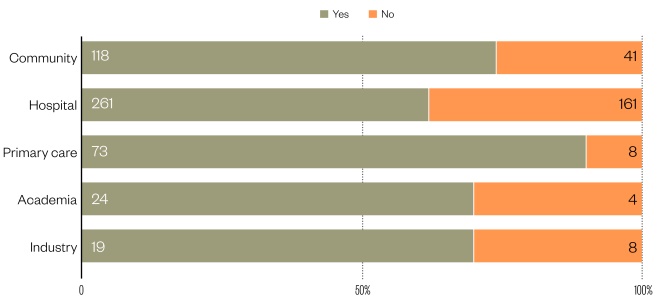
Q: Have you had a pay rise within the last year?
Primary care respondents were most likely to have received a pay rise within the past year
Prospects
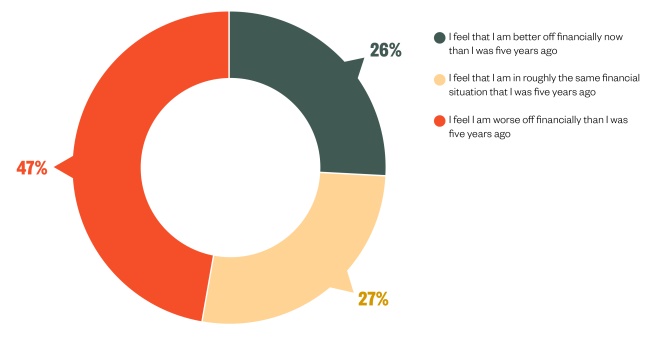
Q: Overall, do you feel that you are better or worse off financially than you were five years ago? (n=1,072)
Despite most respondents receiving a pay rise within the past year, almost half still felt that they were worse off financially than they were five years ago
Work/life balance
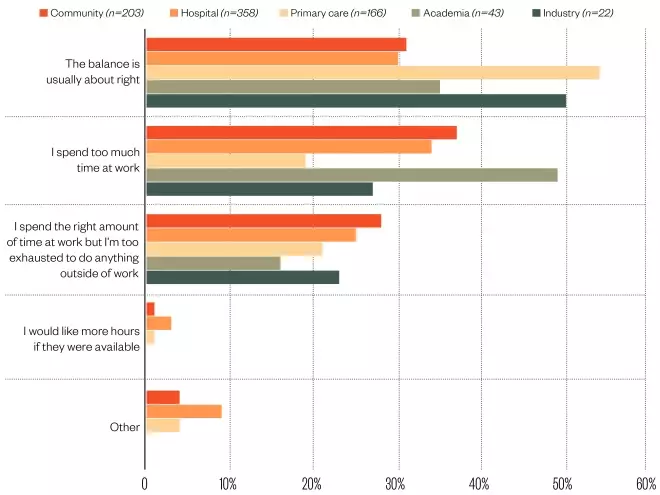
Q: How would you describe your work–life balance?
Over half of primary care respondents felt their work–life balance was about right, whereas only around a third of community and hospital respondents felt this way
Barriers
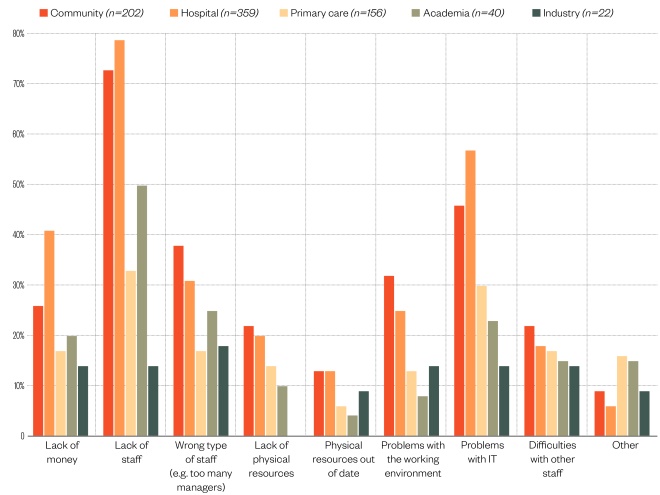
Q: What do you believe are the barriers to you doing your job properly? Select all applicable
Lack of staff is a clear barrier for most community and hospital respondents
Loyalty to profession
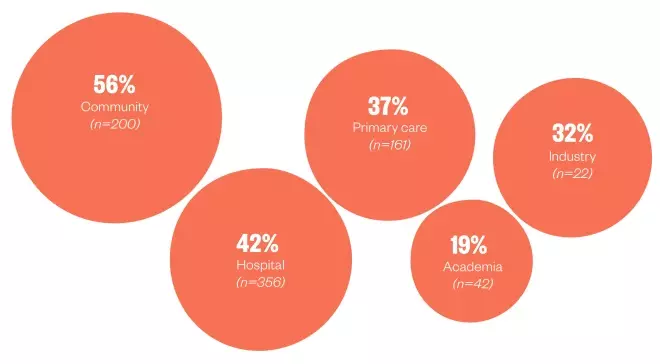
Q: Have you considered leaving the profession in the past year?
Percentage of those who responded “yes”
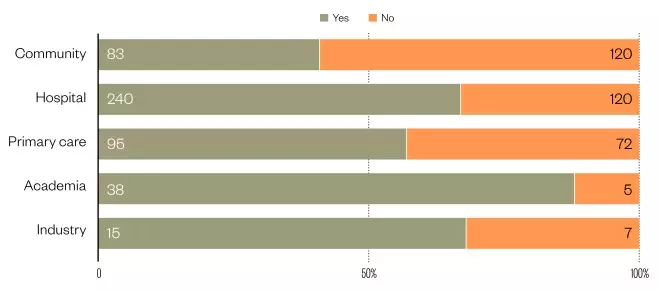
Q: Would you recommend pharmacy as a profession to others?
Community respondents were least likely to recommend the profession to others
Reaching statistical significance: lessons from our first salary survey
The 2017 Pharmaceutical Journal Salary Survey was the journal’s first attempt at performing a workforce salary and satisfaction survey.
The task at first appeared simple — prepare a list of questions to capture as much data as possible, recruit participants, analyse the dataset for reportable results, and employ the skills of a biostatistician to confirm statistical significance.
However, five months and 1924 respondents later, the biostatistician deemed the results statistically… insignificant, or rather statistical significance was unable to be determined owing to factors discussed below. This was a sobering and unexpected finding despite the seemingly endless data that had been collected and analysed. It was only after a lengthy discussion with our biostatistician, Megala, that we discovered the flaws in our methodology. Regardless, by publishing our results we hope to increase awareness and add to the discussion about issues surrounding pharmacy, and how this influences job satisfaction and loyalty to the profession.
Below is a summary of the lessons we have learnt.
Sometimes less is more
Collecting as much data as possible without understanding what value it has, proved to be impractical. The sheer volume of data generated was overwhelming. The results published in the 2017 Salary Survey Infographic represent less than a quarter of the data that was actually collected.
Although we set out to answer a number of questions by collecting extensive data, including geographical information, sector-specific details as well as first and second preregistration placements, it has been hard to objectively address the results in light of questions owing to the relationship between differing factors.
In 2018, the aim is to develop questions which are clear and concise and reflect the results being collected. Information that is useful and usable. It should be noted, however, that without this initial mass collection of data, identifying relevant themes to focus on for this year’s survey would have been a much more onerous task.
It is not just about what you ask, but how you ask it
The manner in which questions are worded and how responses are designed to be answered, influences how the data will be analysed.
For example, by specifying ranges instead of exact figures, it is not possible to determine an average or median salary. In addition, free text answers provide respondents with more flexibility when answering questions, but make analysing the data extremely difficult.
Power in numbers
Statistical significance was not achieved in most cases owing to low numbers in certain categories, even after combining them. For example, with lower or higher salary bands. Although in some instances, this was unavoidable as the outcome became apparent only after completion of the analysis.
One example is the question: ‘Is the pay gap between employed male and female non-locum pharmacists within various age groups statistically significant?’ Although we were able to determine statistical significance (P <0.001) to support the hypothesis that there is a gender pay disparity within a certain age group, there was not enough data to ascertain which gender earns more or less, and within which salary band.
Know your limitations
Statistics is not my forte. Therefore, the input and advice from Megala was invaluable. An important lesson we learnt is that it is never too early to include a biostatistician in the process, especially when working remotely. This is to provide guidance and advice on the sample size needed for the survey to address specific research questions, study design, mock data analysis tables and detailed analysis plan.
Failure is an amazing data point which tells you which direction not to go
I would not consider the salary survey from last year a wasted effort or a failure; rather it was a necessary step for us to take in order to plan for this year.
I would like to thank everyone who took the time to complete the survey from 2017. The success of our survey is reliant on pharmacist participation; and therefore I would encourage readers to participate in the 2018 Pharmaceutical Journal Salary Survey, due to be rolled out in July 2018. It is our aim to build on the lessons we have learnt from last year, and by continuing to perform the survey we hope to report data which are not only robust, but also truly representative of the pharmacy workforce.
DISCLAIMER:
In our survey, community and industry pharmacists were under-represented compared with all RPS members (31% vs 60% and 2% vs 5%, respectively), and hospital and primary care pharmacists were over-represented (38% vs 20% and 16% vs 4%, respectively). Respondents for academia and other were comparable (4% vs 4% and 9% vs 7%, respectively). Women were also slightly over-represented compared with all RPS members (70% vs 60%). The statistical significance of the survey data was unable to be determined because of low sample numbers, therefore reader discretion is required.
Analysis performed by Megala Thiruvothiyur, biostatistician at the University of Aberdeen.
Reading this article counts towards your CPD
You can use the following forms to record your learning and action points from this article from Pharmaceutical Journal Publications.
Your CPD module results are stored against your account here at The Pharmaceutical Journal. You must be registered and logged into the site to do this. To review your module results, go to the ‘My Account’ tab and then ‘My CPD’.
Any training, learning or development activities that you undertake for CPD can also be recorded as evidence as part of your RPS Faculty practice-based portfolio when preparing for Faculty membership. To start your RPS Faculty journey today, access the portfolio and tools at www.rpharms.com/Faculty
If your learning was planned in advance, please click:
If your learning was spontaneous, please click: