Shutterstock.com
After reading this article, you should be able to:
- Understand the different types of electrocardiogram (ECG);
- Calculate heart rate and establish if rhythm is regular from a 12-lead ECG;
- Be familiar with the components and waveforms of a sinus rhythm ECG;
- Recognise basic ECG abnormalities.
Introduction
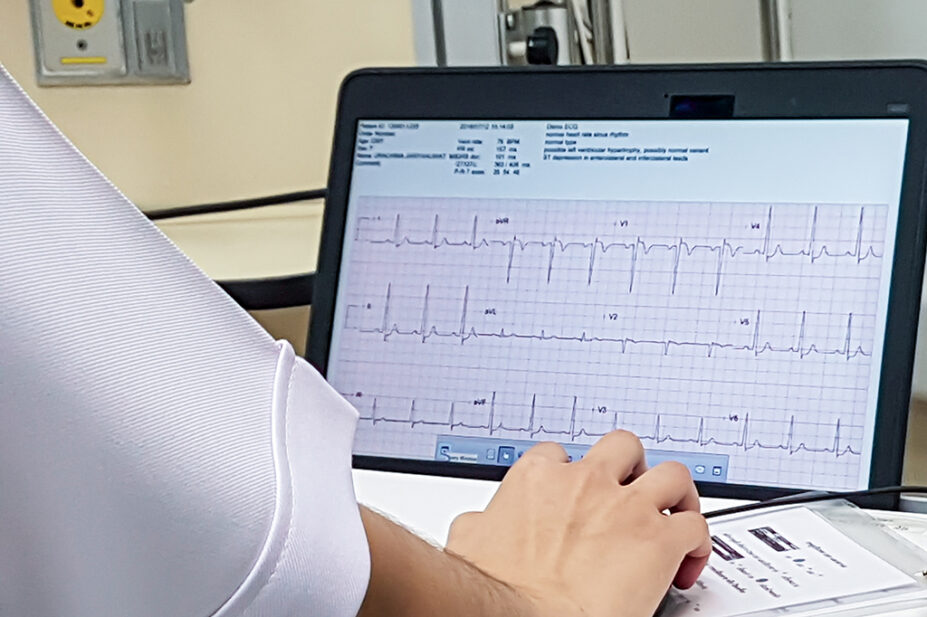
The electrocardiogram (ECG) is a commonly performed, non-invasive diagnostic test to record the electrical activity of the heart. It is performed in a range of healthcare settings; for example, as part of a routine check up, in acute coronary syndrome and perioperative assessment. Increasingly, pharmacists are taking on clinical and prescribing roles, where interpretation of ECGs has become important in their day-to-day practice to help guide treatment interventions. It can be used as part of medicines review and prescribing in all settings; for example, checking for drug interactions on QT prolongation, drug toxicity or drug induced arrhythmias. Some pharmacists may already be providing palpation and basic rhythm checks for their patients as part of early detection of atrial fibrillation. ECG readings should be used together with other tests, such as blood tests or physical examinations, to inform prescribing decisions. This article gives an overview of how the ECG works, the different types of leads and a brief overview of some commonly encountered ECG abnormalities.
Basic electrophysiology of the heart
The heart contracts and relaxes owing to the depolarisation and repolarisation of myocardial cells. The sinoatrial (SA) node, situated in the right atrium, generates electrical impulses that travel to the atrioventricular (AV) node, located in the atrioventricular septum. This electrical activity then travels through the bundle of His, across the left and right ventricles, along the Purkinje fibres[1]. The ECG allows this activity to be measured, providing clinicians with information that can be used to help diagnose and monitor problems in the heart.
Function of an ECG machine
The ECG works by placing a series of electrodes on the body, positioned to produce different perspectives of the heart’s activity from a range of angles, through both the vertical and horizontal plane[2,3]. These perspectives are referred to as leads, which correspond to specific anatomical regions of the heart (see Table).
Most commonly, ECG readings are produced by placing 10 electrodes on different parts of the chest and limbs, which combine to produce 12 leads. The electrode on the right leg is a ground wire and does not contribute to the ECG reading. Figure 1 provides an animation showing the positioning of the 10 electrodes[4].
The aVR, aVL and aVF leads correspond with each other to form what is known as ‘Einthoven’s triangle’, which provides a basis for calculating leads I, II and III[4]. A full explanation of Einthoven’s triangle is beyond the scope of this article but the concept is explained in the literature for readers who would like to know more about the mathematical basis of ECG readings.
The chest electrodes V1 to V6 are positioned at the front and side of the chest to provide a range of views on the horizontal plane.
This combination of 12 leads provides a detailed three-dimensional view of the heart’s electrical activity (see Figure 2 animation).
Different types of ECGs
Different ECG machines have been developed to provide flexibility in their use and to facilitate a range of testing approaches.
Resting 12-lead ECG
As the name suggests, the resting 12-lead ECG is used when the patient is stationary. It is the standard test used to check the heart’s rhythm and electrical activity.
Exercise 12-lead ECG
The exercise 12-lead ECG is recorded while the patient is walking on a treadmill or cycling on an exercise bike. This type of ECG is useful where symptoms are triggered by physical activity. The ‘Bruce protocol’ is a commonly adopted method, which consists of successive three-minute stages of increasing speed and steepness on a treadmill[5]. During the test, a minimum of 85% of the predicted maximal heart rate should be achieved. Maximal heart rate is calculated by subtracting the patients age in years from 220[5,6]. For example, for a person aged 50 years, their maximal heart rate is 220 minus 50, which equals 170 beats per minutes (bpm); 85% of this target is 145bpm. Prior to the test, patients may be instructed to withhold medicines that can interfere with maximal heart rate, such as beta blockers[5,7].
Ambulatory ECG or Holter monitor
The ambulatory ECG, or Holter monitor, allows for continuous monitoring of the heart, typically over 24–48 hours, while the patient carries out their regular, daily activities. This type of ECG is useful for patients whose symptoms occur unpredictably or in short episodes. A typical device will generate two or three channels of reading[8,9]. Patients are provided with a diary to document symptoms, such as palpitations and dizziness. After the monitoring period, the device is returned for analysis[8]. This advancement in technology has led to an increase in the range of commercially available monitoring devices. Devices come in a variety of forms, including smartwatches and single or multiple handheld electrodes, which transmit the readings to a smartphone for storage[10,11]. As this modality of rhythm and rate monitoring becomes increasingly accessible to the general public, pharmacists should be prepared for patients who may wish to discuss their results with them on an unscheduled basis.
ECG results
Most ECG machines will have computerised analysis and interpretation of ECGs; however, these results must be confirmed by an experienced clinician. Relying solely on the automated result can lead to inaccurate diagnosis and potentially expose the patient to inappropriate and unnecessary treatment[12]. The ECG result should be reviewed promptly and the patient should be informed of the result and involved in the decision-making process for any follow up investigations and treatment. The findings and outcomes must be documented in the patient’s medical records together with the ECG printout.
Reading ECG paper
ECG readings are transcribed on paper that is made up of grids of small and large squares. One small square (1mm) represent 0.04 seconds, and 1 large square represents 0.2 seconds[3,4,13]. The paper speed is set at 25mm per second, with one complete ECG reading at 10 seconds long[4]. The vertical axis of the graph paper measures the amplitude of the measured wave or deflection; this is calibrated at 10mm per 1 millivolt (see Figure 3 animation)[4,13]. The paper speed and voltage will be printed at the bottom or top of the page.
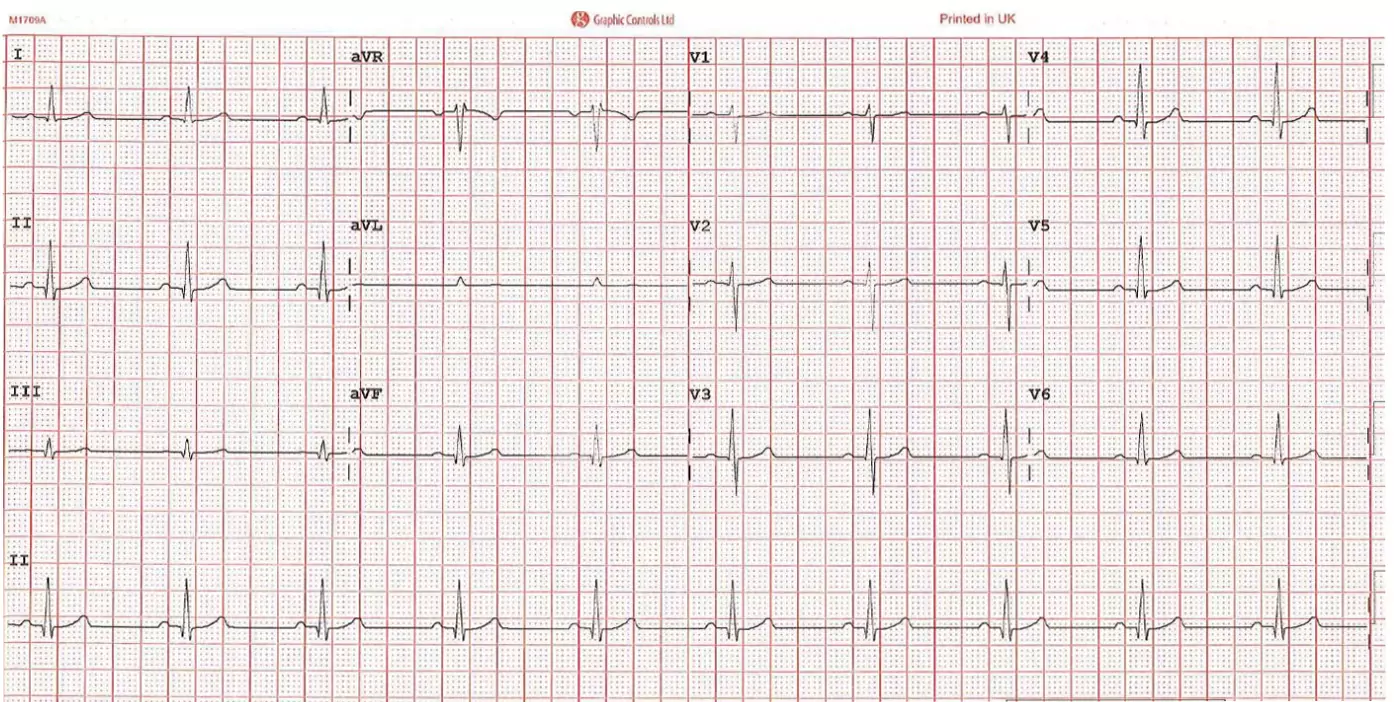
Figure 4 shows a typical 12-lead ECG printout, displaying the separate lead readings from the limbs (I, II, III, aVR, aVL, aVF) and the chest (V1, V2, V3, V4, V5, V6). The bottom lead reading is the rhythm strip (II), which presents readings over the full 10 seconds and is used for the purpose of deducing heart rhythm[4].
ECG training
Components of an ECG reading
When an electrical impulse is travelling towards an ECG electrode, it causes an upright or positive deflection on the lead reading, whereas electrical activity travelling away from an electrode will cause a downward or negative deflection[2]. As previously discussed, each lead is viewing the heart at a different angle; therefore, depending on where the lead is positioned and whether electrical impulses are travelling towards or away from the lead, this will be reflected in its waveform. For example, the aVR electrode is situated at the right arm or shoulder, hence is presented as a negative deflection on the ECG.
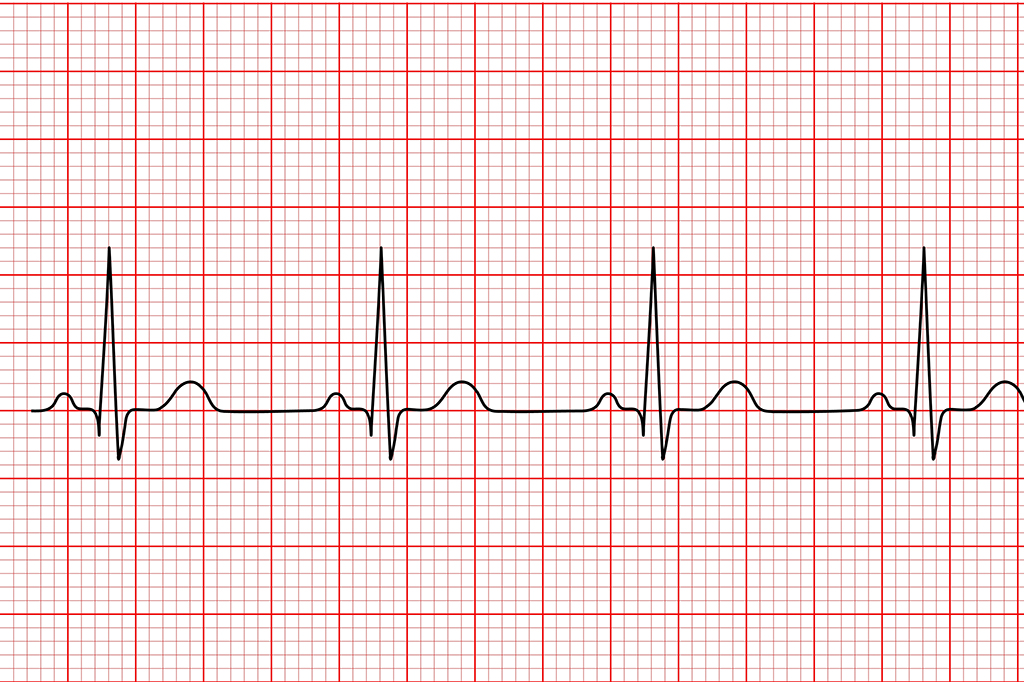
The deflections seen within an ECG waveform can then be analysed, with each deflection receiving a graphical representation from P through to T (see Figure 5). The P wave represents atrial depolarisation. The PR interval, which starts from the beginning of the P wave through to the start of the QRS complex, represents the time taken for the electrical activity to travel from the atria, through the AV nodes, to the ventricles. The QRS complex represents the depolarisation of the ventricles, followed by the ventricle repolarisation as represented by the T wave (see Figure 5)[3,13].
The cardiac axis is the average direction of the electrical activity; normally, the cardiac axis of the QRS is analysed to determine this activity (see Figure 6). In a normal ECG, the cardiac axis falls between -30o and +90o. An axis between -30o and -90o is termed left axis deviation (LAD). An axis between +90o and +180o is termed right axis deviation (RAD) and an axis between -90o and -180o is referred to extreme axis deviation (EAD)[13]. The limb leads are used to determine the cardiac axis, with different methods used to calculate this. Causes of left axis deviation include left ventricular hypertrophy, left bundle branch block, inferior myocardial infarction and hyperkalaemia. Causes of right axis deviation include right ventricular hypertrophy, right bundle branch block and lateral myocardial infarction[13].
Heart rate and rhythm calculations
The heart rate and rhythm can be deduced from a 12-lead ECG. To calculate a patient’s heart rate (in bpm) in regular rhythm, with the paper speed set at 25mm per second, count the number of large squares between an R-R interval and divide 300 by this number. In irregular rhythm, refer to the rhythm strip and count the number of complexes and then multiply this number by 6[2,14]. To check if a pattern of ECG is occurring regularly, compare the R-R interval distances along the rhythm strip. This can be done by marking the start and end of several R-R intervals on the edge of a paper and moving it along the strip[14].
Other ECG abnormalities
The ECG can also identify other abnormalities in the heart.
Heart block
First-degree heart block occurs where there is a delayed AV conduction and shows as a fixed prolonged PR interval exceeding 0.2 seconds[14,15]. Second-degree heart block is divided into Mobitz type I (also known as Wenckebach) and Mobitz type II (see Figure 7). Mobitz type I typically presents as a progressive prolongation of the PR interval then loss of a QRS complex[14,15]. Mobitz type II is usually suggestive of a delay in the bundle of His and Purkinje fibre pathway[15]. As such, a typical ECG trace will show no change in the length of the PR interval; instead, there is an intermittent disappearance of the QRS complex[14].
In third-degree heart block, there is a complete failure of impulse conduction. There is dissociation between the P waves and QRS complexes, with independent atrial and ventricular rates. Cardiac function is maintained through junctional or ventricular escape rhythms. The QRS complexes are narrowed or widened, depending on the origin of the escape rhythms[14,15].
Atrial fibrillation versus atrial flutter
Atrial fibrillation is typically characterised as an irregularly irregular rhythm with absence of P waves, tachycardia and fibrillation waves[4,16,17]. Atrial flutter presents as flutter waves, which give a ‘saw-tooth’ pattern on the ECG, most prominently seen in leads II, III and aVF[18,19]. The atrial rate is approximately 300bpm, and with a typical 2:1 conduction ratio, the ventricular rate is at 150bpm. Although 2:1 conduction ratios are common, other atrial to ventricular rate ratios can occur; for example, 3:1 (100bpm) and 4:1 (75bpm)[19].
QT prolongation
The QT interval is dependent on the heart rate; it lengthens in slower heart rates and shortens in faster heart rates[13]. To take into account the effect of the heart rate, corrected QT intervals (QTc) are calculated; for example, using Bazett’s formula: QTc = QT/√RR[20]. The QTc is prolonged if it is more than 440ms in men and more than 460ms in women[13,21]. Medication, especially a combination of medicines that might prolong the QT interval, should be reviewed and alternative treatments considered. Examples of commonly used medicines that prolong the QT interval are amitriptyline, erythromycin and amiodarone[21].
Hyperkalaemia
Severe hyperkalaemia typically manifests in ECG as peaked T waves, gradually diminishing P waves, PR interval prolongation and wide QRS complexes[22,23]. In the presence of ECG changes, intravenous calcium (gluconate or chloride) is administered to stabilise the cardiac membrane and ECG should improve within 1–3 minutes[22,23]. Medicines that increase serum potassium should be suspended, such as angiotensin enzyme-converting inhibitors and potassium sparing diuretics.
ECG best practice advice
- Familiarise yourself with your local policy and procedures for how ECGs are requested, performed, signed off and recorded;
- Follow a systematic method of interpreting ECGs;
- Practice reading ECGs in your day-to-day practice;
- Do not read an ECG in isolation — consider the clinical context of the patient;
- Ask for a second opinion or confirmation of your interpretation of an ECG, if required.
Test yourself
Shutterstock.com
- 1Aboulhosn R. The Heart’s Conduction System. Geeky Medics. 2020.https://geekymedics.com/the-hearts-conduction-system/ (accessed Mar 2023).
- 2Meek S. ABC of clinical electrocardiography: Introduction. I—Leads, rate, rhythm, and cardiac axis. BMJ. 2002;324:415–8. doi:10.1136/bmj.324.7334.415
- 3Potter L. Understanding of an ECG. Geeky Medics. 2022.https://geekymedics.com/understanding-an-ecg/ (accessed Mar 2023).
- 4Mar PL, Van Tuyl JS, Lim MJ. Basic surface electrocardiogram interpretation for the pharmacist. American Journal of Health-System Pharmacy. 2021;78:850–61. doi:10.1093/ajhp/zxab070
- 5Exercise ECG testing: Performing the test and interpreting the ECG results. UpToDate. 2023.https://www.uptodate.com/contents/exercise-ecg-testing-performing-the-test-and-interpreting-the-ecg-results (accessed Mar 2023).
- 6Kharabsheh SM, Al-Sugair A, Al-Buraiki J, et al. Overview of Exercise Stress Testing. Annals of Saudi Medicine. 2006;26:1–6. doi:10.5144/0256-4947.2006.1
- 7Hill J. ABC of clinical electrocardiography: Exercise tolerance testing. BMJ. 2002;324:1084–7. doi:10.1136/bmj.324.7345.1084
- 8Kowey PR, Kocovic DZ. Ambulatory Electrocardiographic Recording. Circulation. 2003;108. doi:10.1161/01.cir.0000082930.04238.8c
- 9Sampson M. Ambulatory electrocardiography: indications and devices. British Journal of Cardiac Nursing. 2019.https://openresearch.lsbu.ac.uk/download/0a7b7b41af4f2b0993762bdd6b8c68fd855c8404cd78d36684c4a80c061a719d/829363/Ambulatory%20ECG%20monitoring%20FINAL%20AUTHOR.pdf (accessed Mar 2023).
- 10Madias C. Ambulatory ECG monitoring. UpToDate. 2022.https://www.uptodate.com/contents/ambulatory-ecg-monitoring/print (accessed Mar 2023).
- 11Ikeda T. Current Use and Future Needs of Noninvasive Ambulatory Electrocardiogram Monitoring. Intern. Med. 2021;60:9–14. doi:10.2169/internalmedicine.5691-20
- 12Schläpfer J, Wellens HJ. Computer-Interpreted Electrocardiograms. Journal of the American College of Cardiology. 2017;70:1183–92. doi:10.1016/j.jacc.2017.07.723
- 13ECG tutorial: Basic principles of ECG analysis. UpToDate. 2023.https://www.uptodate.com/contents/ecg-tutorial-basic-principles-of-ecg-analysis (accessed Mar 2023).
- 14Jackson M. How to read an ECG. Geeky Medics. 2022.https://geekymedics.com/how-to-read-an-ecg/ (accessed Mar 2023).
- 15ECG tutorial: Atrioventricular block. UpToDate. 2023.https://www.uptodate.com/contents/ecg-tutorial-atrioventricular-block (accessed Mar 2023).
- 16Wade E. Atrial fibrillation. Geeky Medics. 2022.https://geekymedics.com/atrial-fibrillation/ (accessed Mar 2023).
- 17Chronic atrial fibrillation. BMJ Best Practice. 2023.https://bestpractice.bmj.com/topics/en-gb/1 (accessed Mar 2023).
- 18Atrial flutter. BMJ Best Practice. 2023.https://bestpractice.bmj.com/topics/en-gb/3000224 (accessed Mar 2023).
- 19Overview of atrial flutter. UpToDate. 2023.https://www.uptodate.com/contents/overview-of-atrial-flutter (accessed Mar 2023).
- 20Meek S. ABC of clinical electrocardiography: Introduction. II—Basic terminology. BMJ. 2002;324:470–3. doi:10.1136/bmj.324.7335.470
- 21Yap YG. Drug induced QT prolongation and torsades de pointes. Heart. 2003;89:1363–72. doi:10.1136/heart.89.11.1363
- 22Hyperkalemia in adults: Rapid overview of emergency management. UpToDate. 2023.https://www.uptodate.com/contents/image?imageKey=NEPH%2F74169 (accessed Mar 2023).
- 23Potter L. Hyperkalaemia. Geeky Medics. 2013.https://geekymedics.com/hyperkalaemia/ (accessed Mar 2023).