This content was published in 2004. We do not recommend that you take any clinical decisions based on this information without first ensuring you have checked the latest guidance.
As experts on medicines, pharmacists should be able to select the most appropriate drug for an individual, recommend the dosage regimen that is most likely to achieve the desired therapeutic response with minimum risk of toxic effects and monitor the effects of a drug, if appropriate. In order to do this, the principles of pharmacokinetics and pharmacodynamics need to be applied. Most pharmacists will remember learning these at university but not all will have kept them at their fingertips. It is important to appreciate that these principles are fundamental to the current practice of clinical pharmacy and may become even more significant as pharmacists expand their roles into prescribing.
Pharmacokinetic equations describe the relationships between the dosage regimen and the profile of drug concentration in the blood over time. Pharmacodynamic equations describe the relationships between the drug concentration-time profile and therapeutic and adverse effects. By controlling the plasma concentration-time profile of a drug, we can ensure that the patient receives optimum treatment.
Initiating treatment
When a patient requires treatment with a new drug, a loading dose can be given so that therapeutic quickly. Loading doses are commonly used in acute conditions, such as status asthmaticus or status epilepticus, or if the drug has a long elimination half-life (eg, digoxin).
Volume of distribution
In many respects, calculating a loading dose of a drug is similar to calculating the amount of drug required to achieve a desired concentration in a flask of liquid (i.e., dose = volume x concentration). Conversely, the volume of the flask can be estimated if the amount of drug and the measured concentration are known (i.e., volume = dose + concentration).
In clinical practice, the volume of distribution of a drug (V) can be estimated from a known dose and measured concentrations. Because concentrations are typically analysed in blood, serum or plasma, the estimate represents the “apparent” volume throughout which the amount of drug would need to distribute in order to produce the measured concentration. For example, if two drugs, A and B, are both given as 100mg intravenous bolus doses and the measured plasma concentrations are 10mg/L and 1mg/L, the corresponding volumes of distribution would be 10L and 100L, respectively.
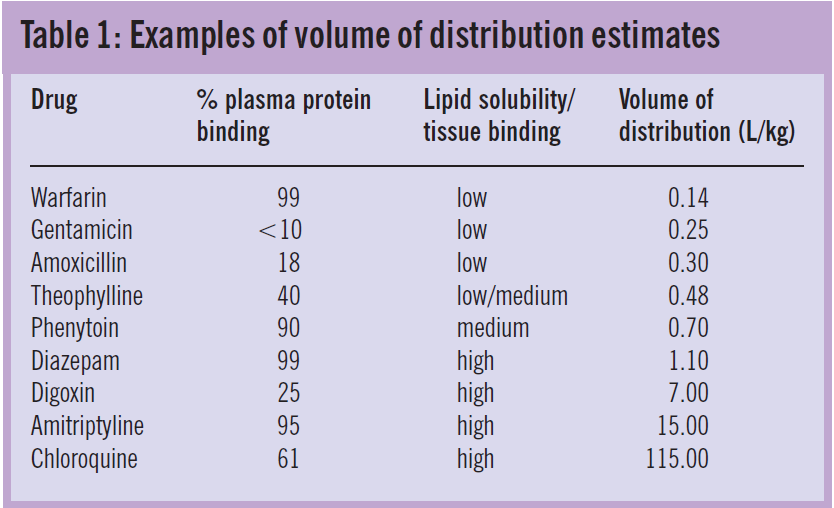
Variability in apparent volume of distribution between drugs reflects the proportion of the administered dose that remains in the plasma. Drugs that are water- soluble or highly bound to plasma proteins have a high plasma concentration relative to the dose, hence small volumes of distribution. In contrast, drugs that are lipid soluble or bind extensively to tissues are present in plasma in low concentrations and, therefore, have large volumes of distribution.
Variability in volume of distribution among patients is often also related to body weight. Table 1 shows weight-related average volumes of distribution for a range of drugs with different solubility and binding characteristics.
Target concentration
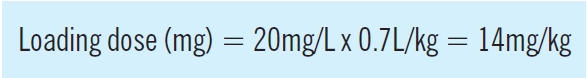
An estimate of a drug’s volume of distribution and the con- centration range that is associated with the desired clinical response can be used to calculate the loading dose that would achieve the target concentration in a particular patient. The use of phenytoin to treat status epilepticus illustrates this point. Phenytoin concentrations in the range 10—20mg/L are associated with seizure control but, because status epilepticus is a life-threatening condition, the target is usually at least 20mg/L. Using a typical estimate of volume of distribution for phenytoin of 0.7L/kg (Table 1), the loading dose can be calculated as follows:
This relationship can also be used to calculate “top-up” doses that may be required if the drug is already present but the concentration is too low. Here, the measured concentration is subtracted from the target concentration (C), leading to the following general expression:

Salt correction factor Phenytoin is usually administered as the phenytoin sodium salt, which contains 92mg phenytoin per 100mg salt. Therefore, applying the salt correction factor (0.92) the loading dose of phenytoin sodium required is 15mg/kg (14mg/kg + 0.92), as quoted in the British National Formulary. It follows that the loading dose for a 40kg patient would be 600mg whereas 1,200mg would be required for an 80kg patient.
Molar correction factor If the target concentration is expressed in molar units, the equation must also include a molar correction factor, which is obtained from the molecular weight of the drug. For example, the molecular weight of phenytoin is 252.3 hence 1 mole is contained in 252.3g of phenytoin. In other words, 1g contains 0.004mol and 1mg contains 4µmol. A target phenytoin concentration of 80µmol/L is, therefore, equivalent to 20mg/L.
Continuing treatment
If a treatment needs to be continued, further calculations can be performed to determine the most appropriate maintenance dose.
Maintenance dose and clearance
In some respects, patients are like leaky flasks because drugs start to be eliminated from the body as soon as they are absorbed. Target drug concentrations can, therefore, only be maintained if doses are given at a rate that balances the clearance rate. Maintenance dosage regimens are designed to achieve this balance.
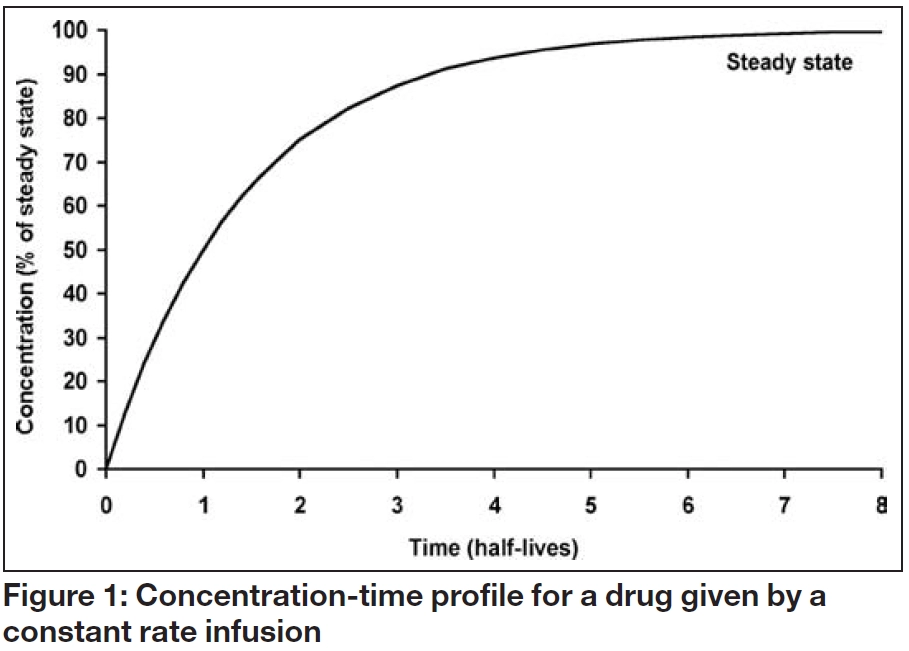
Figure 1 shows the serum concentration-time profile of a drug that is being administered by constant rate infusion, with no loading dose. Although the concentration initially increases with time, the increase gets progressively smaller until the overall profile is flat. This is known as “steady state” and the steady state concentration (Css) depends solely on the balance between the infusion rate (IR) and the clearance rate (Cl), as follows:
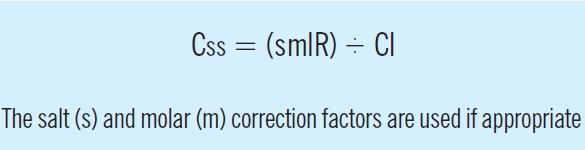
This relationship means that if a measured steady state concentration is too low or too high, a new dose can be determined by direct proportion. For example, to double the Css, the infusion rate should be doubled, whereas to halve the concentration, the infusion rate should be halved. Alternatively, the infusion rate required to achieve a target steady state concentration can be calculated as follows:

It is important that the units of these relationships are consistent. If the dose is administered in milligrams, the concentration will usually be in mg/L (mass units) or µmol/L (molar units) but if the dose is administered in micrograms, the concentration will be in µg/L (mass units) or nmol/L (molar units).
Factors affecting clearance
Clearance represents the volume of blood, serum or plasma completely cleared of drug per unit of time and therefore has units of volume/time. It is usually expressed in L/h or ml/min. Although clearance is often related to the size of the patient (e.g., L/h/kg), it is also influenced by a number of other clinical characteristics. Water-soluble drugs are generally cleared by excretion into the urine, whereas lipid soluble drugs often have to be metabolised to water-soluble metabolites by the liver before they can be excreted. Some drugs are cleared by a combination of renal excretion and hepatic metabolism. These mechanisms mean that clearance and, therefore, maintenance dose requirements can be affected by a range of factors, including age, renal disease, hepatic disease and drug interactions.
Bioavailability and oral maintenance dosage regimens
If a drug is given by a route that requires absorption, such as oral, subcutaneous or intramuscular administration, the amount that reaches the systemic circulation is usually less than the administered dose. The proportion of the administered dose that the systemic circulation is known as the bioavailability and is usually denoted “F” (i.e., the fraction absorbed).
Many factors can influence bioavailability, including the physicochemical characteristics of the drug and its formulation, the degree of first-pass metabolism in the liver or intestine, the activity of gut transporters (such as P- glycoprotein), the co-administration of other drugs and gastrointestinal conditions (e.g., malabsorption syndromes, diarrhoea and vomiting). Drugs with a high first-pass metabolism, such as morphine, propranolol and verapamil, have a low oral bioavailability and oral doses are, consequently, much higher than intravenous doses. In contrast, other drugs (e.g., diazepam, phenytoin and theophylline) have bioavailability’s that are close to 100 per cent and have similar oral and intravenous doses.
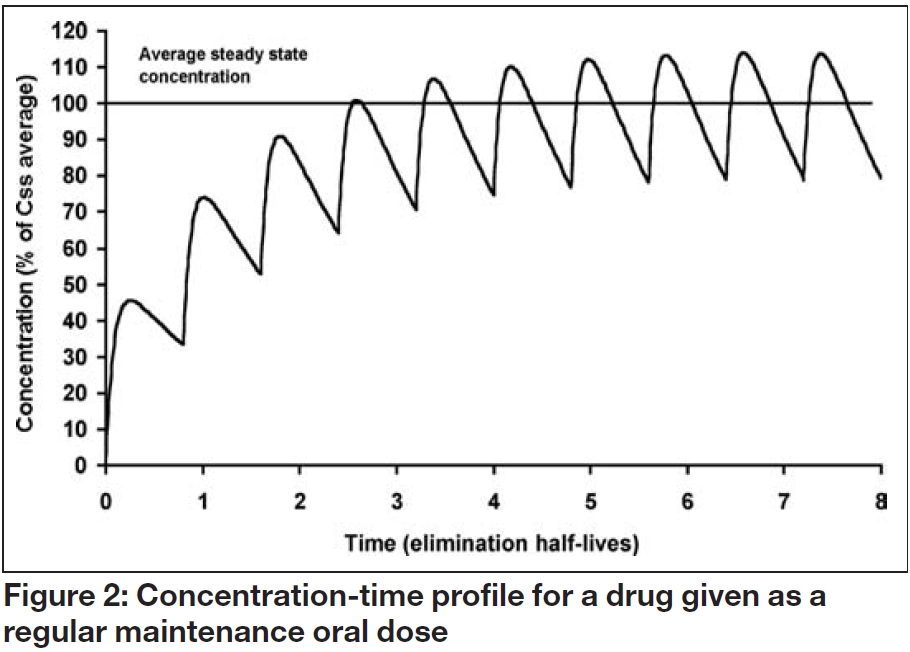
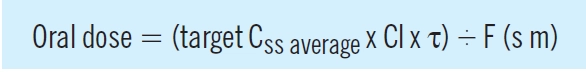
When a maintenance oral dosage regimen is started, the overall profile of accumulation to steady state parallels that observed with a constant rate infusion. However, fluctuations occur within a dosage interval (τ) as each dose (D) is absorbed and eliminated, as illustrated in Figure 2. The average steady state concentration (Css average), is the mean of all the concentrations in the dosage interval, and again depends on the ratio of dosing and clearance rate:
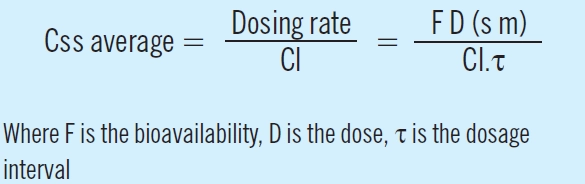
Consequently, an oral maintenance dose can be determined from the following relationship:
Stopping treatment
When treatment is stopped, the time it takes for the drug to be removed from the body can be of interest, particularly if the patient is experiencing adverse effects.
Elimination rate constant and concentration-time profile
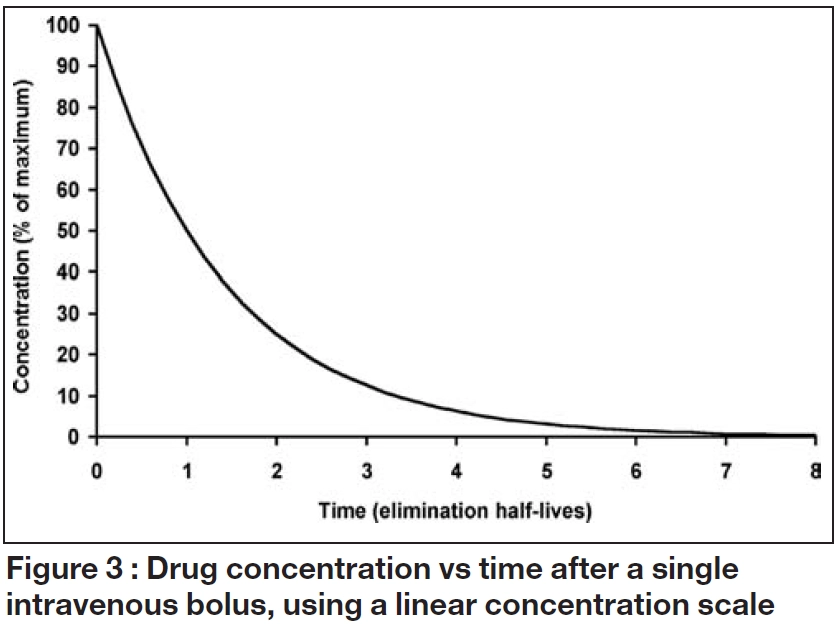
When drug input or absorption is complete, a constant proportion of the dose is usually cleared per unit time. Figure 3 illustrates the consequences of this “first order” elimination after a single intravenous bolus dose. Initially, there is a steep fall in the concentration then the decline becomes shallower as the amount of drug remaining falls. The shape of the relationship between concentration and time is described by exponential function, and the concentration at any time after the dose (Ct) can be calculated from:
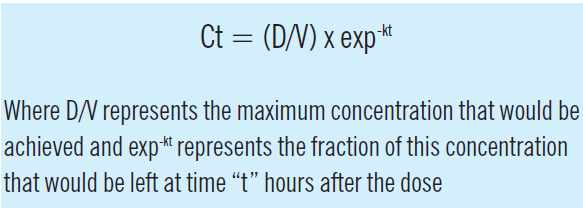
The elimination rate constant (k) is the ratio of clearance to volume of distribution and is usually expressed in units of 1/h. When this concentration-time profile is plotted on a log-linear scale, the decline is linear, with a slope of -k.
Elimination half-life
The elimination half-life (the time it takes for the concentration of the drug to fall to half; t1/2) depends on the elimination rate constant and, consequently, on both clearance and volume of distribution. In that case, the proportion remaining is 0.5, therefore:

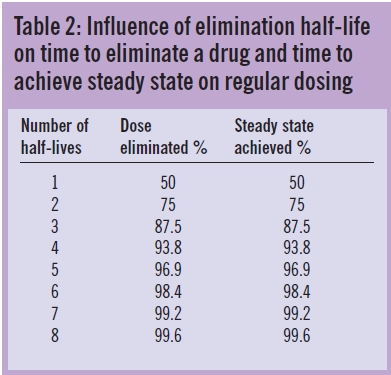
These relationships illustrate that drugs, themselves, do not have half-lives but patients have half-lives. For example, gentamicin, which is cleared by renal excretion, has a half- life of two to three hours in a young adult with normal renal function but as much as 24 hours, or more, in a patient with severe renal impairment. Similarly, a patient with fluid overload may need to receive a higher dose less frequently due to an enlarged volume of distribution and longer elimination half-life. As shown in Table 2 and illustrated in Figures 1 to 3, the elimination half-life determines the time it takes for a drug to be removed from the body and the time it takes to achieve steady state on a regular maintenance dose.
For many drugs, the aim is to avoid large fluctuations in the concentration-time profile and this is normally achieved by using a dosage interval that is shorter than the typical elimination half- life. However, this may demand that some drugs are taken two or three times daily, which can reduce adherence. This has led to the development of new formulations where the rate of drug release and therefore the rate of absorption are reduced, thus allowing once daily dosing. This approach has been used successfully for a number of drugs, including nifedipine, diltiazem and verapamil.
Summary
Drug dosage regimens are determined by two basic parameters, clearance, which determines the dosage rate to maintain an average steady state concentration, and volume of distribution, which determines the amount of drug required to achieve a target concentration. Related parameters, the elimination rate constant, k, (the ratio of clearance to volume of distribution), and elimination half-life (0.693/ k) control the speed of elimination of drugs from the body. They are used to estimate the time taken for a drug to be eliminated from the body and to achieve steady state on multiple dosing.
Further reading
- Begg E. Instant Clinical Pharmacology. Oxford: Blackwell Publishing Ltd; 2002.
- Ritschel WA and Kearns GL. Handbook of Basic Pharmacokinetics, 5th edition. Washington: American Pharmaceutical Association; 1999.
- Winter ME. Basic clinical pharmacokinetics, 3rd edition. Vancouver: Applied Therapeutics Inc; 1994.