This content was published in 2004.
We do not recommend that you take any clinical decisions based on this information without first ensuring you have checked the latest guidance.
Identify knowledge gaps
- List five drugs that need therapeutic monitoring
- What factors affect the time at which a blood sample should be taken for measuring drug levels?
- Why are some hospitals using gentamicin regimens with high doses at longer intervals?
Although pharmacokinetic differences in drug handling between patients produce wide variabilities in serum drug concentration measurements, dosage adjustments are generally only required if there is serious organ damage, such as severe renal impairment. Dosage requirements of individual patients can also vary significantly if a drug has a narrow therapeutic index. In such circumstances, dose titration based on the response to the drug would be ideal. For example, the dose of warfarin can be adjusted according to the international normalised ratio.
However, for other drugs, therapeutic effects are not easily measured and toxic effects may be non-specific. In these circum-stances, assuming the relationship between the drug concentration and the response is known, measuring the concentration of the drug in the patient’s blood can provide useful information.
When to collect a sample
Drug concentrations are usually measured in whole blood or serum, although saliva, which gives a measure of the unbound drug con-centration, may be a useful alternative when blood samples are difficult to collect. For example, measuring phenytoin concentrations in children.
Unlike most sampling for biochemistry and haematology, the timing of the sample (in relation to the previous dose) influences the interpretation of a drug concentration measurement. For most drugs, the relationship between response and concentration (and, therefore, target concentrations) are based on steady-state samples (see PJ,19 June, p769) taken at specific times after the dose.
“Trough” concentrations (at the end of the dosage interval) are commonly used for anti-convulsant drugs, whereas “peak” concentration measurements may be useful for some antibiotics. The relationship between concentration and response is sometimes determined by the time above a threshold value (for example, the minimum inhibitory concentration [MIC]).
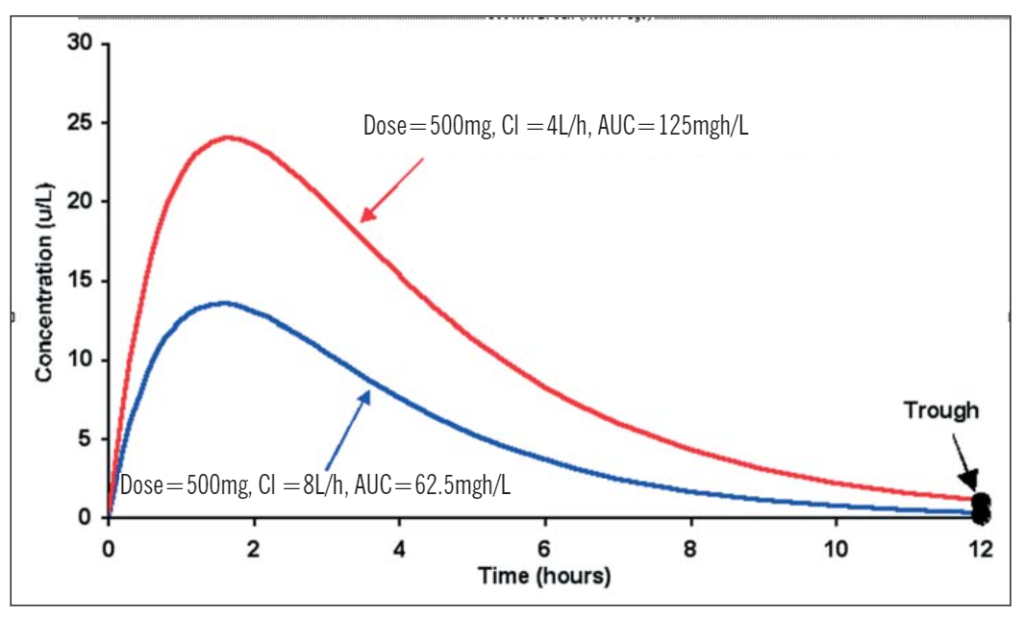
Responses to some anticancer drugs and immunosuppressants have been related to the patient’s overall exposure to the drug, as measured by the area under the concentration-time curve (AUC). The AUC takes into account both the dose and the patient’s ability to clear the drug. So:
Figure 1 illustrates that, despite being given the same dose, a patient whose clearance is 4L/h has an overall exposure to the drug that is twice that of a patient whose clearance is 8L/h. Note, however, that in this case their trough concentration measurements are similar. This mean that if only trough samples are taken, both patients would appear to have the same dosage requirements. Similar problems occur when there is wide variability in bioavailability.
Figure 1. Profiles illustrating the differences in area under the concentration-time curves with a single oral dose of 500mg and a clearance of 4L/h and 8L/h
Anti-infective agents
Many anti-infective agents have a wide therapeutic range, which means that standard doses can be used. However, with some antibiotics (eg, gentamicin), toxicity is associated with persistently high concentrations whereas with others (e.g., vancomycin), treatment failure can result from persistently low concentrations. Antibiotics are often classed as “time-dependent”, where the aim is to maintain concentrations above the MIC for most of the dosage interval or as “concentration-dependent”, where the aim is to achieve high peak concentrations but allow the concentration to fall to low levels between doses.
Aminoglycoside antibiotics
Aminoglycosides have concentration-dependent activity against gram-negative organisms. The higher the peak, the faster the kill rate. Clinical efficacy has been related to the ratio of the peak concentration to the MIC. A ratio of 8 to 10 (i.e., concentrations around 10mg/L) is the most effective for gentamicin. Since traditional doses of 1.5mg/kg eight hourly rarely achieve adequate peaks but often produce excessive troughs, some hospitals have started using higher doses at 12 to 24 hour intervals while others use single doses of 5–7mg/kg with extended intervals of 24 to 48 hours. These changes have presented analytical challenges in the monitoring of aminoglycoside therapy because the peaks and troughs attained can be in ranges associated with high assay variability.
Many hospitals still measure peak and trough concentrations but aim for peaks above 7mg/L for gram-negative septicaemia rather than the traditional 5 to 10mg/L range. Concentrations less than 2mg/L remain the target for the trough although with 12 to 24 hourly dosing, troughs often fall below1mg/L. Table 1 shows sampling times and a range of target concentration ranges for various anti-infective agents.
When doses of 5–7mg/kg are used, peak concentrations are usually above 10mg/L and require dilution while troughs are either below the detection limit or at a level where precision is poor. Samples are, therefore, often taken six to 14 hours after the dose, when the measurement is normally within a range that has acceptable precision. The result is then plotted on a nomogram, such as a Hartford nomogram[1]. This tool uses the sampling time and drug concentration measurement to determine whether the dosage interval needs to be increased.

Glycopeptide antibiotics
In contrast with the aminoglycosides, the glycopeptide antibiotics, vancomycin and teicoplanin exhibit time-dependent activity and the aim is, therefore, to achieve a flat profile that maintains concentrations above the MIC. In the past, both peak and trough concentrations of vancomycin were monitored but there was little agreement on either the timing or the target range of peak concentrations. Trough concentrations of 5 to 10mg/L (i.e., at least two to four times the MIC) are usually considered adequate but up to 15mg/L may be required for some serious infections. Some hospitals use constant rate in-fusions of vancomycin, aiming to maintain concentrations between 15 and 25mg/L.
Teicoplanin concentrations are not measured routinely but this can be useful if under-dosing is suspected, especially if the infection is severe or deep-seated. Target troughs vary according to the condition being treated.
Antitubercular drugs
Low concentrations of rifampicin have been associated with treatment failure and although unreliable adherence is often blamed, poor absorption may also be a factor. Monitoring concentrations can help to clarify these issues and identify patients who need higher doses. Rifampicin has a short elimination-half life so trough concentrations are undetectable and peak concentrations measured two hours after the dose are normally used. However, because the rate of absorption is slow in some patients, the peak may occur later than this and an additional sample six hours after the dose may be useful. Other antitubercular drugs that can be monitored include cycloserine, isoniazid, rifabutin, pyrazinamide and streptomycin[2].
Antifungal drugs
Amphotericin concentrations are rarely measured but peak concentrations of flucytosine above 100mg/L have been associated with neurotoxicity and treatment failure is a possibility if trough concentrations drop below 25mg/L. There is some evidence that trough concentrations of itraconazole above 0.5mg/L are desirable so monitoring of this drug could become more common.
Antiretroviral drugs
Unexplained treatment failures and a high incidence of drug interactions have led to an interest in the monitoring of antiretroviral drug concentrations. The protease inhibitors (e.g., saquinavir, nelfinavir, ritonavir, indinavir) have received particular attention because of their complex and variable pharmacokinetics and the recognised association between trough plasma concentrations and virological response. Other parameters that are currently under investigation include using the inhibitory quotient (ratio of the trough con-centration to the IC50 — the drug concentration that inhibits replication in 50 per cent of the virus isolate) and resistance testing to guide decisions about which drugs to use and at what dose.
The role of therapeutic drug monitoring for non-nucleoside reverse transcriptors is not yet clear but target concentration ranges have been identified for efavirenz. In contrast, it is unlikely that monitoring will be useful for the nucleoside reverse transcriptase inhibitors (e.g., zidovudine, lamivudine) because their effects depend on the intracellular concentrations of triphosphate anabolites rather than the plasma concentrations of the parent drug.
Immunosuppressants
Ciclosporin blocks the replication of lymphocytes and inhibits the release and production of interleukin-2. It plays an important role in a range of clinical conditions, including organ transplantation. It has long been recognised that low ciclosporin concentrations can increase the chance of graft rejection while high concentrations are associated with nephrotoxicity. Therefore, therapeutic drug monitoring is advisable. However, ciclosporin is difficult to measure and early immunoassays detected both parent drug and a range of metabolites, leading to wide variability in proposed target ranges. Current assay methods are more specific and the focus has changed from analytical issues to the relationships between pharmacokinetic parameters (e.g., AUC) and response.
Initial studies focused on trough concentration measurements but this is a relatively insensitive indicator of the patient’s exposure to ciclosporin because of the wide variability in oral bioavailability. There is a closer relationship between AUC and response than with trough concentration and response, which has led to the use of absorption pro-filing using three or four samples or a single two hour post dose (“C2”) sample as a surrogate for AUC. Clinical outcomes have improved when doses are adjusted on the basis of C2 rather than trough measurements.
Tacrolimus has many of the analytical difficulties associated with ciclosporin and it also has a low bioavailability. However, there is amore consistent relationship between trough concentration and AUC, so therapy is usually based on trough measurements. Relationships have also been identified between response and concentrations of the newer immunosuppressants, sirolimus, mycophenolic acid and everolimus, but analysis of these drugs currently requires assay techniques that are not generally available in routine clinical laboratories.
Antiepileptic drugs
Monitoring concentrations of antiepileptic drugs became popular during the 1980s when it was recognised that it could help to reduce variability in response and toxicity. Most of the older anticonvulsants are eliminated by hepatic metabolism, leading to a wide range of dose requirements and a high incidence of drug interactions. However, as experience with the traditional anticonvulsants developed, it became clear that other factors, such as the active metabolite of carbamazepine and the concentration-dependent protein binding of valproic acid, limited the value of routine analyses. Currently, valproic acid is rarely analysed, carbamazepine concentrations are occasionally monitored and phenobarbital is rarely used.
Phenytoin monitoring remains useful because its non-linear pharmacokinetics make dose adjustment difficult. However, care is required in patients with low albumin or renal failure because the consequent reduction in plasma protein binding can lead to misinterpretation of total (free and bound) concentration measurements. In such cases, the result can be normalised by using a correction factor.
The newer anticonvulsants have wider therapeutic indices, so the monitoring of drug concentrations is rarely performed in practice. Nevertheless, a tentative target range of 3–14mg/L (12–55μmol/L) has been pro-posed for lamotrigine.
Drugs used in psychiatry
Target ranges have been identified for a number of antidepressants and antipsychotics, many of which are metabolised by cytochrome P450 2D6, an isoenzyme with variable activity due to genetic polymorphism. Significant differences in dosage requirements have been demonstrated between poor metabolisers and extensive metabolisers and, although rare, ultrarapid metabolisers have been identified who have unusually high dosage requirements. Previously, such patients were assumed to have poor adherence because they had low concentrations relative to the prescribed dose. However, with the possible exception of clozapine, the routine analysis of drugs used in psychiatry is not common in the UK, although it is popular in other parts of Europe.
Lithium
Although a valuable drug in the control of mood disorders, lithium has the disadvantage of having a narrow therapeutic range. It is cleared renally, and mimics the excretion and reabsorption of sodium in the renal tubules. Consequently, it accumulates quickly if renal function alters or if the patient becomes dehydrated. It is recommended that lithium concentrations are checked every three months and the target range of 0.4–1mmol/L is based on a sample taken 12 hours after a dose.
Anticancer drugs
Although anticancer drugs have narrow therapeutic ranges, concentrations are not routinely monitored because of a lack of data on concentration-effect relationships. One exception, however, is methotrexate, where folinic acid rescue therapy is based on monitoring the methotrexate concentration 24–48 hours after high dose therapy and continuing until concentrations are below 0.05μmol/L. For other anticancer drugs, monitoring the enzyme responsible for their metabolism has been used to help adjust doses and reduce toxicity of mercaptopurine (thiopurine methyltransferase activity) and fluorouracil (dihydropyrimidine activity).
Digoxin
Digoxin is probably the drug that is monitored most frequently in routine clinical practice but sampling is often inappropriate. Because digoxin takes a long time to distribute into its large volume of distribution, samples taken earlier than this may contain concentrations up to three times the average steady state concentration. This can lead to misinterpretation of the result and an inappropriate dose adjustment. Target concentration ranges for steady state samples taken more than six hours after the dose are 0.8–2mg/L (1–2.6nmol/L). Another common error with digoxin is to ignore the effects of ageing and changes in renal function in patients on long-term therapy. These may not be recognised if patients are receiving repeat prescriptions over a prolonged period, resulting in excessive accumulation and toxicity.
Theophylline
Although theophylline has largely been re-placed by other drugs with less potential for adverse effects, it is still used in some patients. Since it is principally cleared by hepatic metabolism, dosage requirements vary widely and drug interactions remain a major concern. Bronchodilator effects have been demonstrated within the normal target range of 10–20mg/L (55–110μmol/L) but lower concentrations are associated with anti-inflammatory and steroid sparing effects. Consequently, there is some support for reducing the target range to 5–15mg/L (28–80μmol/L), which might reduce the incidence of toxic effects.
Summary
The appropriate use of therapeutic drug monitoring requires more than simply measuring the concentration of a drug in the patient’s blood and comparing it with a target range. It starts when the drug is first prescribed and involves determining an initial dosage regimen that is appropriate for the clinical condition being treated, the patient’s clinical characteristics (age, weight, renal function, etc.) and concomitant drug therapy. When interpreting concentration measurements, factors that need to be considered are: the sampling time in relation to the dose, the dosage history (i.e., whether or not the result represents steady state), the patient’s response, and the desired clinical targets. This information can be used to adjust doses to achieve the optimal response with minimum toxicity.
References
- Nicolau DP, Freeman CD, Belliveau PB, Nightingale CH, Ross JW, Quintiliani R. Experience with a once-daily aminoglycoside program administered to 2,184 adult patients. Antimicrobial Agents and Chemotherapy 1995;39: 650–5.
- Peloquin C. Therapeutic drug monitoring in the treatment of tuberculosis. Drugs 2002;62:2169–83.
Further Reading
- Shenfield GM, editor. Therapeutic drug monitoring, British Journal of Clinical Pharmacology 2001;52: Suppl 1.
- Begg E. Instant clinical pharmacology. Oxford: Blackwell Publishing Ltd; 2002.
- Ritschel WA, Kearns GL. Handbook of basic pharmacokinetics. 5th Ed. Washington DC: American Pharmaceutical Association; 1999.