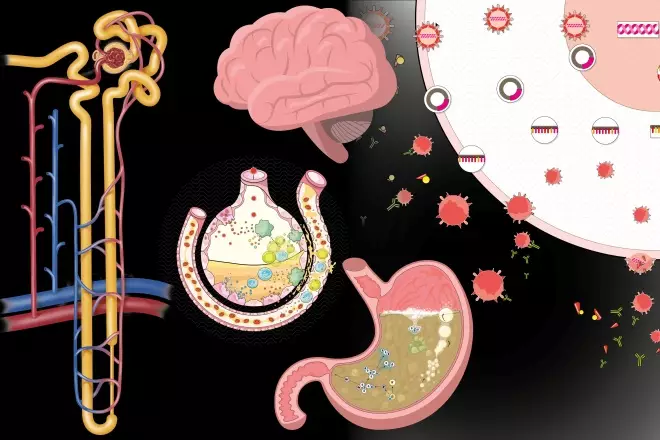
I’m sure it will come as no surprise that The Pharmaceutical Journal’s most-read infographics this year focus on COVID-19.
Our second most popular infographic focuses on the pathology of COVID-19, while readers’ favourite infographic of 2020 illustrated the different approaches being taken to develop a vaccine against SARS-CoV-2.
Other popular infographics this year investigated clinical topics, such as acute kidney injury, indigestion, and anxiety and depression.
Your top five infographics published in 2020 were:
5. Cognitive behavioural therapy: breaking the cycle
Part of our February special issue on non-drug interventions, this infographic looks at how cognitive behavioural therapy works for people with depression and anxiety.
4. Relief from indigestion: a visual guide
Published following the excesses of last Christmas and New Year, this infographic illustrates the over-the-counter options for managing symptoms of indigestion and heartburn — and how they work.
3. Spotting the signs of acute kidney injury
This infographic helps pharmacists spot the signs of acute kidney injury early, and review patients’ medicines before their condition worsens.
2. Targeting COVID-19: the drugs being fast-tracked through clinical trials and how they work
Published in May, this infographic illustrates the pathology of COVID-19 and summarises the many new and repurposed medicines that, at the time, were being investigated as part of nationally prioritised clinical trials.
1. The race to stop COVID-19
This infographic charts the first three months of the pandemic, aiming to put COVID-19 into context with other infectious diseases and illustrate the different approaches being taken to develop a vaccine against SARS-CoV-2.
Get in touch
In 2021, we hope to produce more interactive infographics, so that you can get involved. If there is a topic that you would like us to break down in an infographic, please email your suggestion to: dawn.connelly@rpharms.com or tweet @DawnConnelly73


